
Concept explainers
Videos
a.
To find the regression equation of the given data without the predicted value.
a.
Answer to Problem 61SR
Explanation of Solution
Given:
Following data is given along with a predicted value of 2014

To find an appropriate regression equation of the data, it is first necessary to find out the type of growth.
For this, the difference between adjacent years is calculated in table below.
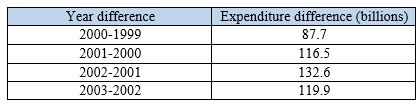
The difference between any 2 years is almost constant as compared to the expenditure where it slightly increases for most part and decrease only for year 2002-2003, however the overall movement of the curve will be similar to a linear model.
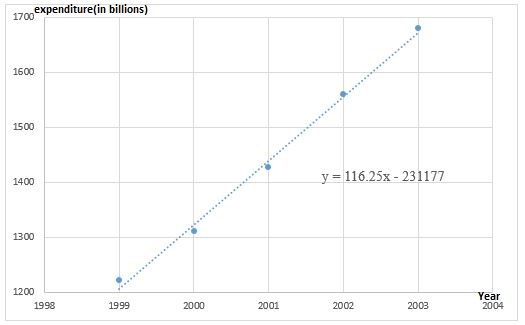
Thus the regression equation of the given data using a linear model will be
Thus the average slope or increase in expenditure each year will be 116.25 billion dollars.
b.
The expenditure in the year 2014 using the equation from the linear model.
b.
Answer to Problem 61SR
2950.5 billion dollars
Explanation of Solution
Given:
The equation found out from the linear model is
Formula used:
Calculation:
To find the value of expenditure in the year 2014, simply substitute
Conclusion:
Thus the predicted expenditure in the year 2014 will be 2950.5 billion dollars.
c.
To compare the prediction of part (b) to the one given in graph.
c.
Answer to Problem 61SR
A variation is observed
Explanation of Solution
Given:
The predicted expenditure in the year 2014 is 2950.5 billion dollars whereas as given in the graph it is 3585.7 billion dollars.
The reason for variation could be that the graph isn’t following clearly a linear model or a quadratic model but a curve in between.
The variation 635.2 billion dollars which is a comparatively small amount with respect to the total expenditure.
Conclusion:
A variation is observed in the predicted value using a regression equation and the predicted value given in graph. It could be due to uneven movement of the curve.
Chapter 3 Solutions
Glencoe Algebra 2 Student Edition C2014
Additional Math Textbook Solutions
Pre-Algebra Student Edition
A First Course in Probability (10th Edition)
Algebra and Trigonometry (6th Edition)
College Algebra with Modeling & Visualization (5th Edition)
Introductory Statistics
A Problem Solving Approach To Mathematics For Elementary School Teachers (13th Edition)


- The Course Name Real Analysis please Solve questions by Real Analysisarrow_forwardpart 3 of the question is: A power outage occurs 6 min after the ride started. Passengers must wait for their cage to be manually cranked into the lowest position in order to exit the ride. Sine function model: where h is the height of the last passenger above the ground measured in feet and t is the time of operation of the ride in minutes. What is the height of the last passenger at the moment of the power outage? Verify your answer by evaluating the sine function model. Will the last passenger to board the ride need to wait in order to exit the ride? Explain.arrow_forward2. The duration of the ride is 15 min. (a) How many times does the last passenger who boarded the ride make a complete loop on the Ferris wheel? (b) What is the position of that passenger when the ride ends?arrow_forward
- 3. A scientist recorded the movement of a pendulum for 10 s. The scientist began recording when the pendulum was at its resting position. The pendulum then moved right (positive displacement) and left (negative displacement) several times. The pendulum took 4 s to swing to the right and the left and then return to its resting position. The pendulum's furthest distance to either side was 6 in. Graph the function that represents the pendulum's displacement as a function of time. Answer: f(t) (a) Write an equation to represent the displacement of the pendulum as a function of time. (b) Graph the function. 10 9 8 7 6 5 4 3 2 1 0 t 1 2 3 4 5 6 7 8 9 10 11 12 13 14 15 -1 -5. -6 -7 -8 -9 -10-arrow_forwardA power outage occurs 6 min after the ride started. Passengers must wait for their cage to be manually cranked into the lowest position in order to exit the ride. Sine function model: h = −82.5 cos (3πt) + 97.5 where h is the height of the last passenger above the ground measured in feet and t is the time of operation of the ride in minutes. (a) What is the height of the last passenger at the moment of the power outage? Verify your answer by evaluating the sine function model. (b) Will the last passenger to board the ride need to wait in order to exit the ride? Explain.arrow_forwardThe Colossus Ferris wheel debuted at the 1984 New Orleans World's Fair. The ride is 180 ft tall, and passengers board the ride at an initial height of 15 ft above the ground. The height above ground, h, of a passenger on the ride is a periodic function of time, t. The graph displays the height above ground of the last passenger to board over the course of the 15 min ride. Height of Passenger in Ferris Wheel 180 160 140- €120 Height, h (ft) 100 80 60 40 20 0 ך 1 2 3 4 5 6 7 8 9 10 11 12 13 14 15 Time of operation, t (min) Sine function model: h = −82.5 cos (3πt) + 97.5 where h is the height of the passenger above the ground measured in feet and t is the time of operation of the ride in minutes. What is the period of the sine function model? Interpret the period you found in the context of the operation of the Ferris wheel. Answer:arrow_forward
- 1. Graph the function f(x)=sin(x) −2¸ Answer: y -2π 一元 1 −1 -2 -3 -4+ 元 2πarrow_forward3. Graph the function f(x) = −(x-2)²+4 Answer: f(x) 6 5 4 3 2+ 1 -6-5 -4-3-2-1 × 1 2 3 4 5 6 -1 -2+ ရာ -3+ -4+ -5 -6arrow_forward2. Graph the function f(x) = cos(2x)+1 Answer: -2π 一元 y 3 2- 1 -1 -2+ ရာ -3- Π 2πarrow_forward
- 2. Graph the function f(x) = |x+1+2 Answer: -6-5-4-3-2-1 f(x) 6 5 4 3 2 1 1 2 3 4 5 6 -1 -2 -3 -4 -5 -6arrow_forward1. The table shows values of a function f(x). What is the average rate of change of f(x) over the interval from x = 5 to x = 9? Show your work. X 4 f(x) LO 5 6 7 8 9 10 -2 8 10 11 14 18arrow_forward• Find a real-world situation that can be represented by a sinusoidal function. You may find something online that represents a sinusoidal graph or you can create a sinusoidal graph yourself with a measuring tape and a rope. • Provide a graph complete with labels and units for the x- and y-axes. • Describe the amplitude, period, and vertical shift in terms of the real-world situation.arrow_forward
 Algebra and Trigonometry (6th Edition)AlgebraISBN:9780134463216Author:Robert F. BlitzerPublisher:PEARSON
 Contemporary Abstract AlgebraAlgebraISBN:9781305657960Author:Joseph GallianPublisher:Cengage Learning
 Linear Algebra: A Modern IntroductionAlgebraISBN:9781285463247Author:David PoolePublisher:Cengage Learning
 Algebra And Trigonometry (11th Edition)AlgebraISBN:9780135163078Author:Michael SullivanPublisher:PEARSON
 Introduction to Linear Algebra, Fifth EditionAlgebraISBN:9780980232776Author:Gilbert StrangPublisher:Wellesley-Cambridge Press
 College Algebra (Collegiate Math)AlgebraISBN:9780077836344Author:Julie Miller, Donna GerkenPublisher:McGraw-Hill Education