
Videos
(a)
To graph the inequalities that represents the weight Jessica and Marc can carry.
(a)
Answer to Problem 27PPS
The inequalities represented by the given data are as follows.
Explanation of Solution
Given Information:
| Jessica | Marc | |
| Food required | pounds | pounds. |
| Water required | gallons | gallons |
| Weight of equipment | pounds | pounds |
| Maximum weight they can carry | pounds | pounds |
Let
Let
According to constraints of weight for Jessica , write the inequality as follows.
Weight of food and water is
Total weight that Jessica can carry =
Therefore,
Similarly for Marc , the inequality will be
Simplification:
Simplify the inequalities and rewrite as follows.
Explanation of graph:
The graph of
The inequality consists of two inequalities
To plot
The graph of
The inequality consists of two inequalities
To plot
Graph:
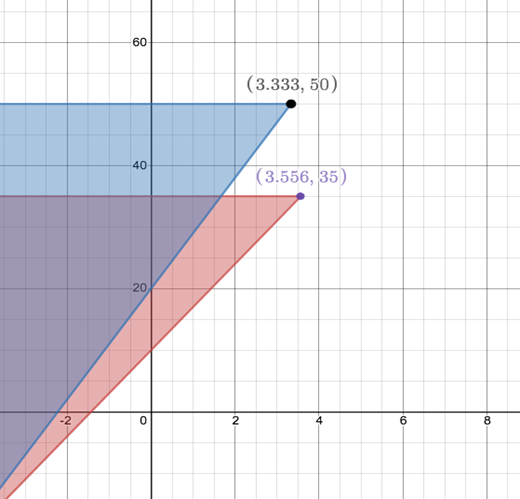
The graph of the given inequalities
(b)
how many days can they camp if it’s assumed that they will bring all their supplies at once.
(b)
Answer to Problem 27PPS
Jessica’s supplies will last for
Explanation of Solution
From the graph it is clear that Jessica’s supplies will last for
(c)
To find: who will run out of the supplies first.
(c)
Answer to Problem 27PPS
Marc’s supplies will run out first
Explanation of Solution
From the graph it is clear that Jessica’s supplies will last for
Marc’s supplies will run out first. He will run out
Chapter 3 Solutions
Glencoe Algebra 2 Student Edition C2014
Additional Math Textbook Solutions
Thinking Mathematically (6th Edition)
Calculus: Early Transcendentals (2nd Edition)
College Algebra with Modeling & Visualization (5th Edition)
A First Course in Probability (10th Edition)
Elementary Statistics (13th Edition)


- Problem #5 Suppose you flip a two sided fair coin ("heads" or "tails") 8 total times. a). How many ways result in 6 tails and 2 heads? b). How many ways result in 2 tails and 6 heads? c). Compare your answers to part (a) and (b) and explain in a few sentences why the comparison makes sense.arrow_forwardA local company has a 6 person management team and 20 employees. The company needs to select 3 people from the management team and 7 employees to attend a regional meeting. How many different possibilities are there for the group that can be sent to the regional meeting?arrow_forwardI have 15 outfits to select from to pack for my business trip. I would like to select three of them to pack in my suitcase. How many packing possibilities are there?arrow_forward
- There are 15 candidates running for any of 5 distinct positions on the local school board. In how many different ways could the 5 positions be filled?arrow_forwardCelina is picking a new frame for a custom piece of artwork. She has to select a frame size, material, and color. There are four different frame sizes, three different frame materials, and six different frame colors. She must chose one option only from each category. How many different possible frames could Celina pick from?arrow_forwardA research study in the year 2009 found that there were 2760 coyotes in a given region. The coyote population declined at a rate of 5.8% each year. How many fewer coyotes were there in 2024 than in 2015? Explain in at least one sentence how you solved the problem. Show your work. Round your answer to the nearest whole number.arrow_forward
 Algebra and Trigonometry (6th Edition)AlgebraISBN:9780134463216Author:Robert F. BlitzerPublisher:PEARSON
 Contemporary Abstract AlgebraAlgebraISBN:9781305657960Author:Joseph GallianPublisher:Cengage Learning
 Linear Algebra: A Modern IntroductionAlgebraISBN:9781285463247Author:David PoolePublisher:Cengage Learning
 Algebra And Trigonometry (11th Edition)AlgebraISBN:9780135163078Author:Michael SullivanPublisher:PEARSON
 Introduction to Linear Algebra, Fifth EditionAlgebraISBN:9780980232776Author:Gilbert StrangPublisher:Wellesley-Cambridge Press
 College Algebra (Collegiate Math)AlgebraISBN:9780077836344Author:Julie Miller, Donna GerkenPublisher:McGraw-Hill Education