
Concept explainers
Videos
(a)
To express: Normal snowfall data and 2007 data in two
(a)
Answer to Problem 28PPS
For Normal Snowfall:
For 2007 Snowfall:
Explanation of Solution
Given information:
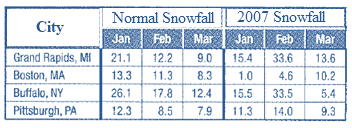
Table shows snowfall (in inches):

Matrix A will represent the Normal Snowfall.
We need
Such that
The rows will represent the cities.
And
The columns will represent each month.
Matrix B will represent the 2007 Snowfall.
We need
Such that
The rows will represent the cities.
And
The columns will represent each month.
(b)
To subtract: Matrix of Normal data from the matrix of 2007 data.
Representation of difference in context of the situation.
(b)
Answer to Problem 28PPS
Matrix:
The numbers in the matrix obtained represent the comparison of Snowfall in 2007 with Normal Snowfall.
Explanation of Solution
Given information:
Table shows snowfall (in inches):
We are required to subtract the 2007 Snowfall matrix from the Normal Snowfall matrix.
Subtract the corresponding elements of each matrix form.
Simplify each element to get the solution.
Thus,
The matrix obtained:
The numbers in the matrix obtained represent the comparison of Snowfall in 2007 with Normal Snowfall.
(c)
To explain: Meaning of positive and negative numbers in the difference matrix and trends observed in the data.
(c)
Answer to Problem 28PPS
For positive numbers:
There was less Snowfall than Normal Snowfall in 2007.
For negative numbers:
There was more Snowfall than Normal Snowfall in 2007.
Explanation of Solution
Given information:
Table shows snowfall (in inches):

Matrix obtained in Part (b),
From this difference matrix,
We came to know that
Some numbers are positive and some numbers are negative.
If the number is positive,
That means
There is less Snowfall in 2007 than Normal Snowfall.
If the number is negative,
That means
There is more Snowfall in 2007 than Normal Snowfall.
For Example:
Grand Rapids, MI had 5.7 fewer inches of snow than Normal in January, 2007.
For all positive numbers:
Some trends in the data represent that the overall Snowfall was very less for every city in January, 2007.
For mostly negative numbers:
There trended to be more snow in most of the cities during February and March, 2007.
Chapter 3 Solutions
Glencoe Algebra 2 Student Edition C2014
Additional Math Textbook Solutions
Elementary Statistics: Picturing the World (7th Edition)
A Problem Solving Approach To Mathematics For Elementary School Teachers (13th Edition)
Thinking Mathematically (6th Edition)
Elementary Statistics (13th Edition)
College Algebra with Modeling & Visualization (5th Edition)
Basic Business Statistics, Student Value Edition


- A research study in the year 2009 found that there were 2760 coyotes in a given region. The coyote population declined at a rate of 5.8% each year. How many fewer coyotes were there in 2024 than in 2015? Explain in at least one sentence how you solved the problem. Show your work. Round your answer to the nearest whole number.arrow_forwardAnswer the following questions related to the following matrix A = 3 ³).arrow_forwardExplain the following termsarrow_forward
- Solve questions by Course Name (Ordinary Differential Equations II 2)arrow_forwardplease Solve questions by Course Name( Ordinary Differential Equations II 2)arrow_forwardInThe Northern Lights are bright flashes of colored light between 50 and 200 miles above Earth. Suppose a flash occurs 150 miles above Earth. What is the measure of arc BD, the portion of Earth from which the flash is visible? (Earth’s radius is approximately 4000 miles.)arrow_forward
- e). n! (n - 1)!arrow_forwardSuppose you flip a fair two-sided coin four times and record the result. a). List the sample space of this experiment. That is, list all possible outcomes that could occur when flipping a fair two-sided coin four total times. Assume the two sides of the coin are Heads (H) and Tails (T).arrow_forwarde). n! (n - 1)!arrow_forward
 Algebra and Trigonometry (6th Edition)AlgebraISBN:9780134463216Author:Robert F. BlitzerPublisher:PEARSON
 Contemporary Abstract AlgebraAlgebraISBN:9781305657960Author:Joseph GallianPublisher:Cengage Learning
 Linear Algebra: A Modern IntroductionAlgebraISBN:9781285463247Author:David PoolePublisher:Cengage Learning
 Algebra And Trigonometry (11th Edition)AlgebraISBN:9780135163078Author:Michael SullivanPublisher:PEARSON
 Introduction to Linear Algebra, Fifth EditionAlgebraISBN:9780980232776Author:Gilbert StrangPublisher:Wellesley-Cambridge Press
 College Algebra (Collegiate Math)AlgebraISBN:9780077836344Author:Julie Miller, Donna GerkenPublisher:McGraw-Hill Education