
Videos
i.
To graph: Each system of inequality and name the coordinates of vertices of the feasible region.
i.
Explanation of Solution
Given information: system of inequalities,
Graph:Sketch the graph.
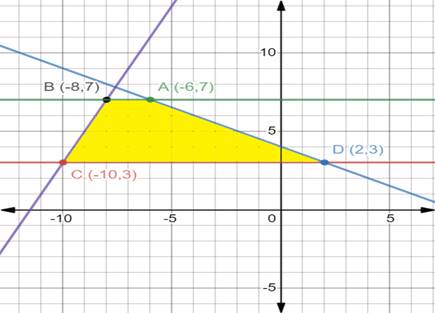
Interpretation:Consider A, B, C and D are 4 point on feasible region formed by given inequality.
ii.
To find: The maximum and minimum values of the region of given function.
ii.
Answer to Problem 13PPS
Maximum values is 59 and minimum value is 9.
Explanation of Solution
Given information: system of inequalities,
And the function
To find the value of maximum and minimum first consider the region from part (a).
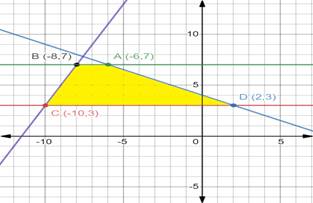
We find the maximum and minimum value by substituting the coordinates of vertices in
For point
For point
For point
Therefore the value at point B is maximum and it is equal to 59. And at point D is minimum of 9.
Chapter 3 Solutions
Glencoe Algebra 2 Student Edition C2014
Additional Math Textbook Solutions
Using and Understanding Mathematics: A Quantitative Reasoning Approach (6th Edition)
Thinking Mathematically (6th Edition)
College Algebra with Modeling & Visualization (5th Edition)
A First Course in Probability (10th Edition)
Elementary Statistics: Picturing the World (7th Edition)


- A research study in the year 2009 found that there were 2760 coyotes in a given region. The coyote population declined at a rate of 5.8% each year. How many fewer coyotes were there in 2024 than in 2015? Explain in at least one sentence how you solved the problem. Show your work. Round your answer to the nearest whole number.arrow_forwardAnswer the following questions related to the following matrix A = 3 ³).arrow_forwardExplain the following termsarrow_forward
- Solve questions by Course Name (Ordinary Differential Equations II 2)arrow_forwardplease Solve questions by Course Name( Ordinary Differential Equations II 2)arrow_forwardInThe Northern Lights are bright flashes of colored light between 50 and 200 miles above Earth. Suppose a flash occurs 150 miles above Earth. What is the measure of arc BD, the portion of Earth from which the flash is visible? (Earth’s radius is approximately 4000 miles.)arrow_forward
- e). n! (n - 1)!arrow_forwardSuppose you flip a fair two-sided coin four times and record the result. a). List the sample space of this experiment. That is, list all possible outcomes that could occur when flipping a fair two-sided coin four total times. Assume the two sides of the coin are Heads (H) and Tails (T).arrow_forwarde). n! (n - 1)!arrow_forward
 Algebra and Trigonometry (6th Edition)AlgebraISBN:9780134463216Author:Robert F. BlitzerPublisher:PEARSON
 Contemporary Abstract AlgebraAlgebraISBN:9781305657960Author:Joseph GallianPublisher:Cengage Learning
 Linear Algebra: A Modern IntroductionAlgebraISBN:9781285463247Author:David PoolePublisher:Cengage Learning
 Algebra And Trigonometry (11th Edition)AlgebraISBN:9780135163078Author:Michael SullivanPublisher:PEARSON
 Introduction to Linear Algebra, Fifth EditionAlgebraISBN:9780980232776Author:Gilbert StrangPublisher:Wellesley-Cambridge Press
 College Algebra (Collegiate Math)AlgebraISBN:9780077836344Author:Julie Miller, Donna GerkenPublisher:McGraw-Hill Education