
Videos
To graph: The inequalities
Explanation of Solution
Given information: Graph the linear inequalities
Method used: Use slope and y - intercept to graph the lines and find the common region for both inequalities which would be the solution region. Then use
Graph:
Consider the inequalities as equation
Graph them by finding slope and y intercept by comparing it with
For the line
Firstly represent the y-intercept (0,4)on xy plane then move down 2 units and right 1 unit to get another point because slope is -2 this could be written as
This line is dotted line because the inequality has no equal sign (no small line under inequality sign) with it.
Like so graph the second line.
For the line
Now, represent (0,-3) on the xy plane and then move down 3 units and right 1 unit to get another point because slope is -3 which could be written as
Then join the points and extend the line on both ends. This line is a solid line because there is a small line under the inequality sign. It means it is less than or equal to.
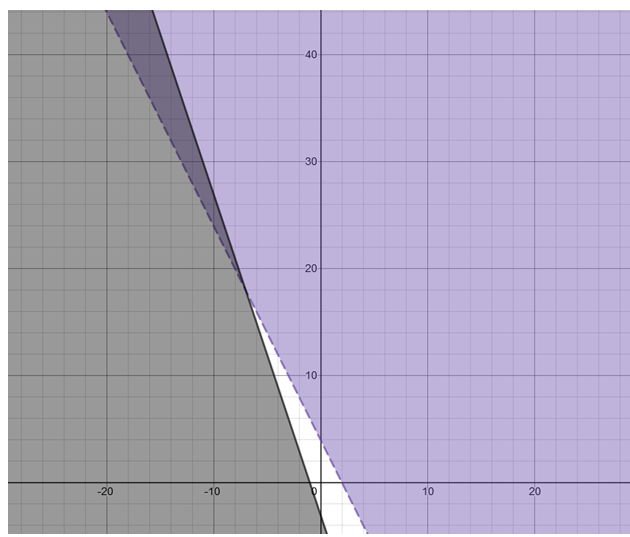
Interpretation: The dark area of the graph is solution region to the inequalities. Ignore the Purple and black areas. Just the combination of these two colors area is solution region.
That region would satisfy the linear inequalities.
Chapter 3 Solutions
Glencoe Algebra 2 Student Edition C2014
Additional Math Textbook Solutions
Pre-Algebra Student Edition
Elementary Statistics: Picturing the World (7th Edition)
Basic Business Statistics, Student Value Edition
Elementary Statistics (13th Edition)
A First Course in Probability (10th Edition)
Algebra and Trigonometry (6th Edition)


- A research study in the year 2009 found that there were 2760 coyotes in a given region. The coyote population declined at a rate of 5.8% each year. How many fewer coyotes were there in 2024 than in 2015? Explain in at least one sentence how you solved the problem. Show your work. Round your answer to the nearest whole number.arrow_forwardAnswer the following questions related to the following matrix A = 3 ³).arrow_forwardExplain the following termsarrow_forward
- Solve questions by Course Name (Ordinary Differential Equations II 2)arrow_forwardplease Solve questions by Course Name( Ordinary Differential Equations II 2)arrow_forwardInThe Northern Lights are bright flashes of colored light between 50 and 200 miles above Earth. Suppose a flash occurs 150 miles above Earth. What is the measure of arc BD, the portion of Earth from which the flash is visible? (Earth’s radius is approximately 4000 miles.)arrow_forward
- e). n! (n - 1)!arrow_forwardSuppose you flip a fair two-sided coin four times and record the result. a). List the sample space of this experiment. That is, list all possible outcomes that could occur when flipping a fair two-sided coin four total times. Assume the two sides of the coin are Heads (H) and Tails (T).arrow_forwarde). n! (n - 1)!arrow_forward
 Algebra and Trigonometry (6th Edition)AlgebraISBN:9780134463216Author:Robert F. BlitzerPublisher:PEARSON
 Contemporary Abstract AlgebraAlgebraISBN:9781305657960Author:Joseph GallianPublisher:Cengage Learning
 Linear Algebra: A Modern IntroductionAlgebraISBN:9781285463247Author:David PoolePublisher:Cengage Learning
 Algebra And Trigonometry (11th Edition)AlgebraISBN:9780135163078Author:Michael SullivanPublisher:PEARSON
 Introduction to Linear Algebra, Fifth EditionAlgebraISBN:9780980232776Author:Gilbert StrangPublisher:Wellesley-Cambridge Press
 College Algebra (Collegiate Math)AlgebraISBN:9780077836344Author:Julie Miller, Donna GerkenPublisher:McGraw-Hill Education