
Concept explainers
Videos
a.
To use the regression feature of a graphing utility to find a linear model  and an exponential model
  for data.
a.
Explanation of Solution
Given Information:
Two models for these data are given below-
Calculation:
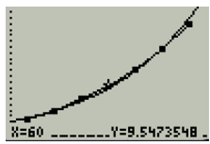
Let us plot the data to graph the model for y1,
Let  be the year which represents 1997 and here y1 and y2 represents the median prices. Midwest is denoted by
  and south is denoted by
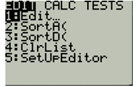
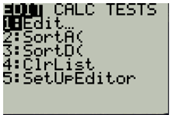
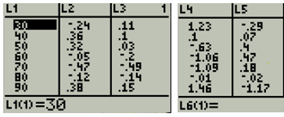
Now, press the STAT key in first step and choose option1.
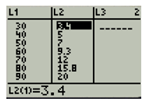
Second step is to write the values of L1 and L2.
Now, press  to quit and return to the home.
Again, press STAT key and then choose CALC
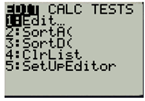
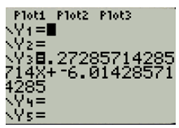
Now, press option 6 to select LinReg for the model
Now, press 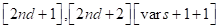 to input in y1
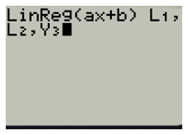
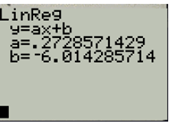
Now, press ENTER key
This is the model for the data.
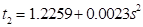
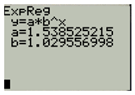
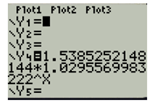
Now, for exponential model press to input in y4
Now, press ENTER key
This is the model for the data
b.
To use the graphing utility to graph the data and each model in the same viewing window.
b.
Explanation of Solution
Here the graph is for linear model graph
Now, copy the linear model equation to the editor
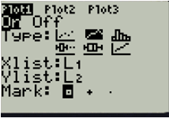
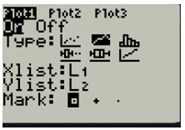
Now, press  to edit plot1 press ENTER and go down to type: and press ENTER to choose the graph and go downwards to Xlist, press
  for L1, press
  for L2.
Press to graph the data for linear model. If you don’t get the graph then press  to zoomstat.
Here the graph is for exponential model graph:
Now, copy the linear model equation to the editor
Now, press  to edit plot1 press ENTER and go down to type: and press ENTER to choose the graph and go downwards to Xlist, press
  for L1 and Ylist, press
Press  to graph the data for linear model. If you don’t get the graph then press,
c.
To create the table comparing the data with estimates obtained from each model.
c.
Explanation of Solution
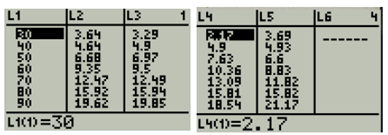
Here, the table comparing the data estimates obtained from the model.
Now, first step is to press STAT key and then press option1.

Second step is to write the values of  and
and 
d.
To use the results of part (c) to find the sum of the absolute values of the differences between the data and estimated values.
d.
Answer to Problem 60E
Yes, it is possible to pay twice as much as in interest charges as the size of the mortagage.
Explanation of Solution
Here, this is the table for the difference between the data and the estimate value.
Now, first step is to press STAT key and then press option1.
Second step is to write the values of  and
and 
And the sum of the value is 

 and
and 
Therefore, the  model is totally fit in the above data.
Chapter 3 Solutions
EBK PRECALCULUS W/LIMITS


- Consider the following system of equations, Ax=b : x+2y+3z - w = 2 2x4z2w = 3 -x+6y+17z7w = 0 -9x-2y+13z7w = -14 a. Find the solution to the system. Write it as a parametric equation. You can use a computer to do the row reduction. b. What is a geometric description of the solution? Explain how you know. c. Write the solution in vector form? d. What is the solution to the homogeneous system, Ax=0?arrow_forward2. Find a matrix A with the following qualities a. A is 3 x 3. b. The matrix A is not lower triangular and is not upper triangular. c. At least one value in each row is not a 1, 2,-1, -2, or 0 d. A is invertible.arrow_forwardFind the exact area inside r=2sin(2\theta ) and outside r=\sqrt(3)arrow_forward
- A 20 foot ladder rests on level ground; its head (top) is against a vertical wall. The bottom of the ladder begins by being 12 feet from the wall but begins moving away at the rate of 0.1 feet per second. At what rate is the top of the ladder slipping down the wall? You may use a calculator.arrow_forwardExplain the focus and reasons for establishment of 12.4.1(root test) and 12.4.2(ratio test)arrow_forwarduse Integration by Parts to derive 12.6.1arrow_forward
- Explain the relationship between 12.3.6, (case A of 12.3.6) and 12.3.7arrow_forwardExplain the key points and reasons for the establishment of 12.3.2(integral Test)arrow_forwardUse 12.4.2 to determine whether the infinite series on the right side of equation 12.6.5, 12.6.6 and 12.6.7 converges for every real number x.arrow_forward
 Calculus: Early TranscendentalsCalculusISBN:9781285741550Author:James StewartPublisher:Cengage Learning
 Thomas' Calculus (14th Edition)CalculusISBN:9780134438986Author:Joel R. Hass, Christopher E. Heil, Maurice D. WeirPublisher:PEARSON
 Calculus: Early Transcendentals (3rd Edition)CalculusISBN:9780134763644Author:William L. Briggs, Lyle Cochran, Bernard Gillett, Eric SchulzPublisher:PEARSON
 Calculus: Early TranscendentalsCalculusISBN:9781319050740Author:Jon Rogawski, Colin Adams, Robert FranzosaPublisher:W. H. Freeman
 Calculus: Early Transcendental FunctionsCalculusISBN:9781337552516Author:Ron Larson, Bruce H. EdwardsPublisher:Cengage Learning