
Concept explainers
Videos
a.
Use a graphing utility to create a
a.
Answer to Problem 24PS
Explanation of Solution
Calculation:
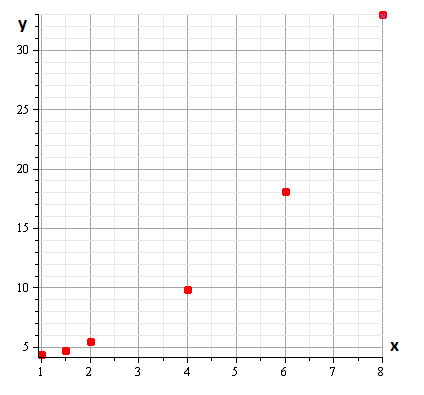
Consider the following data ,
Now draw the scatter plot,

Hence, the scatter plot is drawn.
b.
Verify that the data could best be modelled by a linear model, an exponential model, or a logarithmic model,
b.
Answer to Problem 24PS
Explanation of Solution
Given information:
Decide whether the data could best be modelled by a linear model, an exponential model, or a logarithmic model,
Calculation:
Consider the following data ,
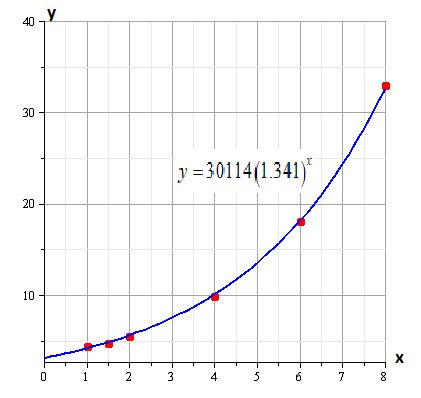
The best model for this data is exponential model.
Hence, the best model is
c.
Explain the model is an exponential model.
c.
Answer to Problem 24PS
Points are growing rapidly,non-linearly.
Explanation of Solution
Calculation:
Consider the following data ,
The best model for this data is exponential model.
It is observed from the graph that points are increasing non-linearly, thus we cannot use a linear model for this condition, it is also that points are growing rapidly thus exponential model is best suited .
Hence, we choose exponential model.
d.
To find the model is an exponential model for the data and graph the model with the scatter plot.
d.
Answer to Problem 24PS
Explanation of Solution
Calculation:
Consider the following data ,
By using the value of
Hence the required model is ,
Now scatter plot for this model,

Hence, the required model is
e.
Describe the model you chose fits the data.
e.
Answer to Problem 24PS
Model fits the data.
Explanation of Solution
Calculation:
Consider the required model is ,
Now scatter plot for this model,

The graph shows model fits the data,
Hence, the model fits the data.
Chapter 3 Solutions
EBK PRECALCULUS W/LIMITS


- For each graph in Figure 16, determine whether f (1) is larger or smaller than the slope of the secant line between x = 1 and x = 1 + h for h > 0. Explain your reasoningarrow_forwardPoints z1 and z2 are shown on the graph.z1 is at (4 real,6 imaginary), z2 is at (-5 real, 2 imaginary)Part A: Identify the points in standard form and find the distance between them.Part B: Give the complex conjugate of z2 and explain how to find it geometrically.Part C: Find z2 − z1 geometrically and explain your steps.arrow_forwardA polar curve is represented by the equation r1 = 7 + 4cos θ.Part A: What type of limaçon is this curve? Justify your answer using the constants in the equation.Part B: Is the curve symmetrical to the polar axis or the line θ = pi/2 Justify your answer algebraically.Part C: What are the two main differences between the graphs of r1 = 7 + 4cos θ and r2 = 4 + 4cos θ?arrow_forward
- A curve, described by x2 + y2 + 8x = 0, has a point A at (−4, 4) on the curve.Part A: What are the polar coordinates of A? Give an exact answer.Part B: What is the polar form of the equation? What type of polar curve is this?Part C: What is the directed distance when Ø = 5pi/6 Give an exact answer.arrow_forwardNew folder 10. Find the area enclosed by the loop of the curve (1- t², t-t³)arrow_forward1. Graph and find the corresponding Cartesian equation for: t X== y = t +1 2 te(-∞, ∞) 42,369 I APR 27 F5 3 MacBook Air stv A Aa T 4 DIIarrow_forward
- Middle School GP... Echo home (1) Addition and su... Google Docs Netflix Netflix New folder 9. Find the area enclosed by x = sin²t, y = cost and the y-axis.arrow_forward2. Graph and find the corresponding Cartesian equation for: (4 cos 0,9 sin 0) θ ε [0, 2π) 42,369 I APR 27 3 MacBook Air 2 tv A Aaarrow_forward30 Page< 3. Find the equation of the tangent line for x = 1+12, y = 1-3 at t = 2 42,369 APR A 27 M . tv NA 1 TAGN 2 Aa 7 MacBook Air #8arrow_forward
 Calculus: Early TranscendentalsCalculusISBN:9781285741550Author:James StewartPublisher:Cengage Learning
 Thomas' Calculus (14th Edition)CalculusISBN:9780134438986Author:Joel R. Hass, Christopher E. Heil, Maurice D. WeirPublisher:PEARSON
 Calculus: Early Transcendentals (3rd Edition)CalculusISBN:9780134763644Author:William L. Briggs, Lyle Cochran, Bernard Gillett, Eric SchulzPublisher:PEARSON
 Calculus: Early TranscendentalsCalculusISBN:9781319050740Author:Jon Rogawski, Colin Adams, Robert FranzosaPublisher:W. H. Freeman
 Calculus: Early Transcendental FunctionsCalculusISBN:9781337552516Author:Ron Larson, Bruce H. EdwardsPublisher:Cengage Learning