
Concept explainers
Videos
a.
To describe: The characteristic of a graph that represents the circulation after 2013.
a.
Explanation of Solution
Given:
The rate of change of circulation of the magazine is declining steadily for last 10 years. The circulation was about 450,000 subscribers in 2013.
The graph for the given scenario can be represented using the x-axis to represent the number of years since 2013 and y-axis the number of subscribers.
Since the number of subscribers is declining steadily, the graph will be a straight line with a negative slope with y-intercept as 450,000.
b.
To describe: The assumption made about the graph of the circulation of the magazine.
b.
Answer to Problem 60PPS
The circulation continues to decline at the same rate after 2013.
Explanation of Solution
Given:
The rate of change of circulation of the magazine is declining steadily for last 10 years. The circulation was about 450,000 subscribers in 2013.
Since the number of subscribers is declining steadily, so it can be assumed that the number of subscribers continues to decline at the same rate after 2013.
c.
To predict: The future of the magazine.
c.
Answer to Problem 60PPS
The circulation continues to decline at the same rate after 2013.
Explanation of Solution
Given:
The rate of change of circulation of the magazine is declining steadily for last 10 years. The circulation was about 450,000 subscribers in 2013.
Since the number of subscribers is declining steadily, so it can be assumed that the number of subscribers continues to decline at the same rate after 2013. Now, draw the graph for the circulation of the magazine as shown below.
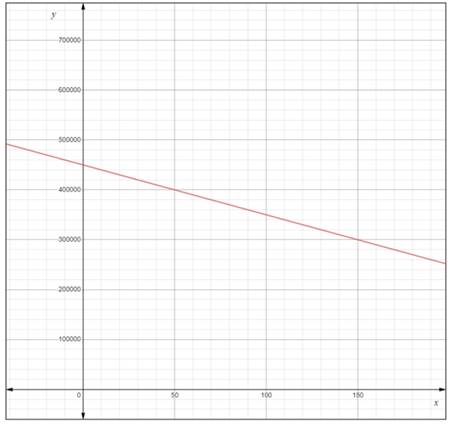
The graph shows that the number of subscribers will become zero in long run.
Chapter 3 Solutions
Glencoe Algebra 1, Student Edition, 9780079039897, 0079039898, 2018
Additional Math Textbook Solutions
Thinking Mathematically (6th Edition)
Basic Business Statistics, Student Value Edition
Intro Stats, Books a la Carte Edition (5th Edition)
A Problem Solving Approach To Mathematics For Elementary School Teachers (13th Edition)
Elementary Statistics: Picturing the World (7th Edition)


- Write the equation for the graphed function. 8+ 7 -8 ง A -6-5 + 6 5 4 3 -2 -1 2 1 -1 3 2 3 + -2 -3 -4 -5 16 -7 -8+ f(x) = ST 0 7 8arrow_forwardThe following is the graph of the function f. 48- 44 40 36 32 28 24 20 16 12 8 4 -4 -3 -1 -4 -8 -12 -16 -20 -24 -28 -32 -36 -40 -44 -48+ Estimate the intervals where f is increasing or decreasing. Increasing: Decreasing: Estimate the point at which the graph of ƒ has a local maximum or a local minimum. Local maximum: Local minimum:arrow_forwardFor the following exercise, find the domain and range of the function below using interval notation. 10+ 9 8 7 6 5 4 3 2 1 10 -9 -8 -7 -6 -5 -4 -3 -2 -1 2 34 5 6 7 8 9 10 -1 -2 Domain: Range: -4 -5 -6 -7- 67% 9 -8 -9 -10-arrow_forward
- 1. Given that h(t) = -5t + 3 t². A tangent line H to the function h(t) passes through the point (-7, B). a. Determine the value of ẞ. b. Derive an expression to represent the gradient of the tangent line H that is passing through the point (-7. B). c. Hence, derive the straight-line equation of the tangent line H 2. The function p(q) has factors of (q − 3) (2q + 5) (q) for the interval -3≤ q≤ 4. a. Derive an expression for the function p(q). b. Determine the stationary point(s) of the function p(q) c. Classify the stationary point(s) from part b. above. d. Identify the local maximum of the function p(q). e. Identify the global minimum for the function p(q). 3. Given that m(q) = -3e-24-169 +9 (-39-7)(-In (30-755 a. State all the possible rules that should be used to differentiate the function m(q). Next to the rule that has been stated, write the expression(s) of the function m(q) for which that rule will be applied. b. Determine the derivative of m(q)arrow_forwardSafari File Edit View History Bookmarks Window Help Ο Ω OV O mA 0 mW ర Fri Apr 4 1 222 tv A F9 F10 DII 4 F6 F7 F8 7 29 8 00 W E R T Y U S D பட 9 O G H J K E F11 + 11 F12 O P } [arrow_forwardSo confused. Step by step instructions pleasearrow_forward
- In simplest terms, Sketch the graph of the parabola. Then, determine its equation. opens downward, vertex is (- 4, 7), passes through point (0, - 39)arrow_forwardIn simplest way, For each quadratic relation, find the zeros and the maximum or minimum. a) y = x 2 + 16 x + 39 b) y = 5 x2 - 50 x - 120arrow_forwardIn simplest terms and step by step Write each quadratic relation in standard form, then fi nd the zeros. y = - 4( x + 6)2 + 36arrow_forward
- In simplest terms and step by step For each quadratic relation, find the zeros and the maximum or minimum. 1) y = - 2 x2 - 28 x + 64 2) y = 6 x2 + 36 x - 42arrow_forwardWrite each relation in standard form a)y = 5(x + 10)2 + 7 b)y = 9(x - 8)2 - 4arrow_forwardIn simplest form and step by step Write the quadratic relation in standard form, then fi nd the zeros. y = 3(x - 1)2 - 147arrow_forward
 Algebra and Trigonometry (6th Edition)AlgebraISBN:9780134463216Author:Robert F. BlitzerPublisher:PEARSON
 Contemporary Abstract AlgebraAlgebraISBN:9781305657960Author:Joseph GallianPublisher:Cengage Learning
 Linear Algebra: A Modern IntroductionAlgebraISBN:9781285463247Author:David PoolePublisher:Cengage Learning
 Algebra And Trigonometry (11th Edition)AlgebraISBN:9780135163078Author:Michael SullivanPublisher:PEARSON
 Introduction to Linear Algebra, Fifth EditionAlgebraISBN:9780980232776Author:Gilbert StrangPublisher:Wellesley-Cambridge Press
 College Algebra (Collegiate Math)AlgebraISBN:9780077836344Author:Julie Miller, Donna GerkenPublisher:McGraw-Hill Education