
Concept explainers
Videos
a.
To find:Equation for the manatee population P, t years since 1991.
a.
Answer to Problem 37PPS
Explanation of Solution
Given information:
In 1991,
Number of Manatees inhabited for Florida’s waters = 1267
Rate of increase of Manatee population per year = 123
Let us assume
From given information
Rate of increase of Manatee population per year = 123
Therefore
Slope = 123
At
Which represents point
Therefore
Y-intercept = 1267
Slope intercept form of given situation is
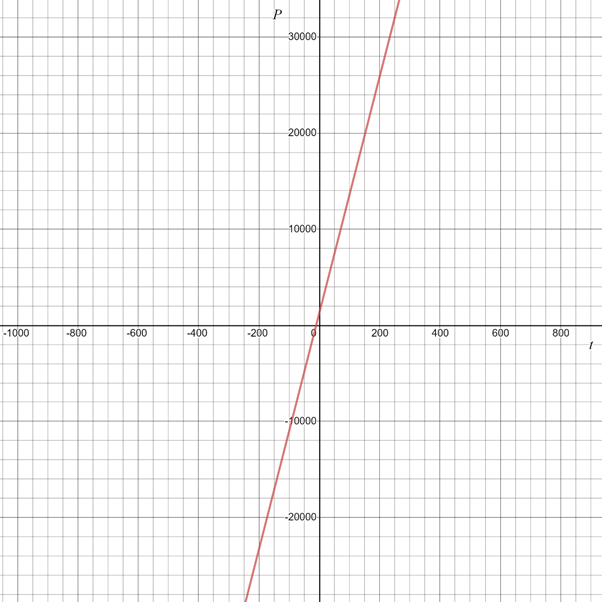
b.
To find: Graph of above equation.
b.
Explanation of Solution
Given information:
In 1991,
Number of Manatees inhabited for Florida’s waters = 1267
Rate of increase of Manatee population per year = 123
Equation of given situation is
Where
P = Manatee Population.
t = number of years since 1991
Graph of equation is
c.
To find: Manatee population in 2006.
c.
Answer to Problem 37PPS
Manatee population in 2006 = 3112
Explanation of Solution
Given information:
In 1991,
Number of Manatees inhabited for Florida’s waters = 1267
Rate of increase of Manatee population per year = 123
Equation of given situation is
We need to find manatee population in 2006
Therefore
Substitute value of
We get
Therefore
Manatee population in 2006 = 3112
Chapter 3 Solutions
Glencoe Algebra 1, Student Edition, 9780079039897, 0079039898, 2018
Additional Math Textbook Solutions
Elementary Statistics: Picturing the World (7th Edition)
Elementary Statistics (13th Edition)
A Problem Solving Approach To Mathematics For Elementary School Teachers (13th Edition)
Elementary Statistics
Algebra and Trigonometry (6th Edition)
College Algebra with Modeling & Visualization (5th Edition)


- 5. (20%) The linear transformation L: P3 → P2 defined by L(f(x)) = f'(x)+ f(0). (a) Find the representing matrix A of L with respect to the ordered basis {x2, x, 1} for P3, and the ordered basis {2,1 - x} for P2. (b) Find the coordinates of the f(x) = 2x² +2 in P3 with respect to the ordered basis {x2,-x, 1}, and find the coordinates of L(f(x)) with respect to the ordered basis {2,1-x}arrow_forwardFor the spinner below, assume that the pointer can never lie on a borderline. Find the following probabilities. (enter the probabilities as fractions)arrow_forwardQuestions 1. Identify and describe potential bias in the study. 2. Identify and describe the way in which the selected participants may or may not represent the population as a whole. 3. Identify and describe the possible problems with the end results since the majority will be from females rather than an even split. 4. Identify and describe the possible problems with identifying females as possibly more vulnerable based on the data collected. 5. Identify a possible null hypothesis and problems in how the study might address this null hypothesis. 6. Identify one possible method of improving the study design and describe how it would improve the validity of the conclusions. 7. Identify a second possible method of improving the study design and describe how it would improve the validity of the conclusions.arrow_forward
- The Course Name Real Analysis please Solve questions by Real Analysisarrow_forwardpart 3 of the question is: A power outage occurs 6 min after the ride started. Passengers must wait for their cage to be manually cranked into the lowest position in order to exit the ride. Sine function model: where h is the height of the last passenger above the ground measured in feet and t is the time of operation of the ride in minutes. What is the height of the last passenger at the moment of the power outage? Verify your answer by evaluating the sine function model. Will the last passenger to board the ride need to wait in order to exit the ride? Explain.arrow_forward2. The duration of the ride is 15 min. (a) How many times does the last passenger who boarded the ride make a complete loop on the Ferris wheel? (b) What is the position of that passenger when the ride ends?arrow_forward
- 3. A scientist recorded the movement of a pendulum for 10 s. The scientist began recording when the pendulum was at its resting position. The pendulum then moved right (positive displacement) and left (negative displacement) several times. The pendulum took 4 s to swing to the right and the left and then return to its resting position. The pendulum's furthest distance to either side was 6 in. Graph the function that represents the pendulum's displacement as a function of time. Answer: f(t) (a) Write an equation to represent the displacement of the pendulum as a function of time. (b) Graph the function. 10 9 8 7 6 5 4 3 2 1 0 t 1 2 3 4 5 6 7 8 9 10 11 12 13 14 15 -1 -5. -6 -7 -8 -9 -10-arrow_forwardA power outage occurs 6 min after the ride started. Passengers must wait for their cage to be manually cranked into the lowest position in order to exit the ride. Sine function model: h = −82.5 cos (3πt) + 97.5 where h is the height of the last passenger above the ground measured in feet and t is the time of operation of the ride in minutes. (a) What is the height of the last passenger at the moment of the power outage? Verify your answer by evaluating the sine function model. (b) Will the last passenger to board the ride need to wait in order to exit the ride? Explain.arrow_forwardThe Colossus Ferris wheel debuted at the 1984 New Orleans World's Fair. The ride is 180 ft tall, and passengers board the ride at an initial height of 15 ft above the ground. The height above ground, h, of a passenger on the ride is a periodic function of time, t. The graph displays the height above ground of the last passenger to board over the course of the 15 min ride. Height of Passenger in Ferris Wheel 180 160 140- €120 Height, h (ft) 100 80 60 40 20 0 ך 1 2 3 4 5 6 7 8 9 10 11 12 13 14 15 Time of operation, t (min) Sine function model: h = −82.5 cos (3πt) + 97.5 where h is the height of the passenger above the ground measured in feet and t is the time of operation of the ride in minutes. What is the period of the sine function model? Interpret the period you found in the context of the operation of the Ferris wheel. Answer:arrow_forward
- 1. Graph the function f(x)=sin(x) −2¸ Answer: y -2π 一元 1 −1 -2 -3 -4+ 元 2πarrow_forward3. Graph the function f(x) = −(x-2)²+4 Answer: f(x) 6 5 4 3 2+ 1 -6-5 -4-3-2-1 × 1 2 3 4 5 6 -1 -2+ ရာ -3+ -4+ -5 -6arrow_forward2. Graph the function f(x) = cos(2x)+1 Answer: -2π 一元 y 3 2- 1 -1 -2+ ရာ -3- Π 2πarrow_forward
 Algebra and Trigonometry (6th Edition)AlgebraISBN:9780134463216Author:Robert F. BlitzerPublisher:PEARSON
 Contemporary Abstract AlgebraAlgebraISBN:9781305657960Author:Joseph GallianPublisher:Cengage Learning
 Linear Algebra: A Modern IntroductionAlgebraISBN:9781285463247Author:David PoolePublisher:Cengage Learning
 Algebra And Trigonometry (11th Edition)AlgebraISBN:9780135163078Author:Michael SullivanPublisher:PEARSON
 Introduction to Linear Algebra, Fifth EditionAlgebraISBN:9780980232776Author:Gilbert StrangPublisher:Wellesley-Cambridge Press
 College Algebra (Collegiate Math)AlgebraISBN:9780077836344Author:Julie Miller, Donna GerkenPublisher:McGraw-Hill Education