
Videos
(a)
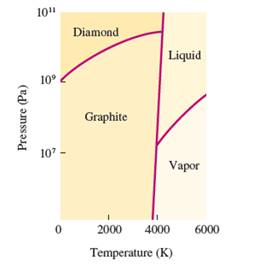
Interpretation: The number of triple points in the given phase diagram of carbon needs to be determined.

Concept Introduction:
The conversion of
The heating -cooling curve is the curve of temperature v/s time that interpret the change in the states of matter with increase in temperature.
Freezing point is the temperature at which the solid state converts to liquid state or vice-versa. Boiling point is the temperature at which the liquid and gas state reach to an equilibrium hence after this temperature, both states must be in equilibrium.
(b)
Interpretation: The phases which coexist at the triple points in the given phase diagram of carbon needs to be determined.

Concept Introduction:
The conversion of solid to liquid and gas involves the change in temperature that can display in heat curve.
The heating -cooling curve is the curve of temperature v/s time that interpret the change in the states of matter with increase in temperature.
Freezing point is the temperature at which the solid state converts to liquid state or vice-versa. Boiling point is the temperature at which the liquid and gas state reach to an equilibrium hence after this temperature, both states must be in equilibrium.
(c)
Interpretation: The change when graphite is subjected at very high pressure at room temperature needs to be explained.
Concept Introduction:
The conversion of solid to liquid and gas involves the change in temperature that can display in heat curve.
The heating -cooling curve is the curve of temperature v/s time that interpret the change in the states of matter with increase in temperature.
Freezing point is the temperature at which the solid state converts to liquid state or vice-versa. Boiling point is the temperature at which the liquid and gas state reach to an equilibrium hence after this temperature, both states must be in equilibrium.
(d)
Interpretation: The denser state out of graphite and diamond needs to be determined, if the density increases with increasing the pressure.

Concept Introduction:
The conversion of solid to liquid and gas involves the change in temperature that can display in heat curve.
The heating -cooling curve is the curve of temperature v/s time that interpret the change in the states of matter with increase in temperature.
Freezing point is the temperature at which the solid state converts to liquid state or vice-versa. Boiling point is the temperature at which the liquid and gas state reach to an equilibrium hence after this temperature, both states must be in equilibrium.
Want to see the full answer?
Check out a sample textbook solution
Chapter 16 Solutions
EBK CHEMICAL PRINCIPLES


- Calculate the chemical shifts in 13C and 1H NMR for 4-chloropropiophenone ? Write structure and label hydrogens and carbonsarrow_forwardPlease sirrr soollveee these parts pleaseeee and thank youuuuuarrow_forwardPlease sirrr soollveee these parts pleaseeee and thank youuuuu, don't solve it by AI plleeaasseeearrow_forward
- Please sirrr soollveee these parts pleaseeee and thank youuuuuarrow_forward4. Read paragraph 4.15 from your textbook, use your calculated lattice energy values for CuO, CuCO3 and Cu(OH)2 an explain thermal decomposition reaction of malachite: Cu2CO3(OH)2 →2CuO + H2O + CO2 (3 points)arrow_forwardPlease sirrr soollveee these parts pleaseeee and thank youuuuuarrow_forward
- III O Organic Chemistry Using wedges and dashes in skeletal structures Draw a skeletal ("line") structure for each of the molecules below. Be sure your structures show the important difference between the molecules. key O O O O O CHON Cl jiii iiiiiiii You can drag the slider to rotate the molecules. Explanation Check Click and drag to start drawing a structure. Q Search X G ©2025 McGraw Hill LLC. All Rights Reserved. Terms of Use F 3 W C 3/5arrow_forward3. Use Kapustinskii's equation and data from Table 4.10 in your textbook to calculate lattice energies of Cu(OH)2 and CuCO3 (4 points)arrow_forward2. Copper (II) oxide crystalizes in monoclinic unit cell (included below; blue spheres 2+ represent Cu²+, red - O²-). Use Kapustinski's equation (4.5) to calculate lattice energy for CuO. You will need some data from Resource section of your textbook (p.901). (4 points) CuOarrow_forward
- What is the IUPAC name of the following compound? OH (2S, 4R)-4-chloropentan-2-ol O (2R, 4R)-4-chloropentan-2-ol O (2R, 4S)-4-chloropentan-2-ol O(2S, 4S)-4-chloropentan-2-olarrow_forwardIn the answer box, type the number of maximum stereoisomers possible for the following compound. A H H COH OH = H C Br H.C OH CHarrow_forwardSelect the major product of the following reaction. Br Br₂, light D Br Br Br Brarrow_forward
 ChemistryChemistryISBN:9781305957404Author:Steven S. Zumdahl, Susan A. Zumdahl, Donald J. DeCostePublisher:Cengage Learning
 Chemistry: An Atoms First ApproachChemistryISBN:9781305079243Author:Steven S. Zumdahl, Susan A. ZumdahlPublisher:Cengage Learning
 Chemistry for Engineering StudentsChemistryISBN:9781337398909Author:Lawrence S. Brown, Tom HolmePublisher:Cengage Learning
 Chemistry: Principles and PracticeChemistryISBN:9780534420123Author:Daniel L. Reger, Scott R. Goode, David W. Ball, Edward MercerPublisher:Cengage Learning
 Chemistry: Principles and ReactionsChemistryISBN:9781305079373Author:William L. Masterton, Cecile N. HurleyPublisher:Cengage Learning