
Videos
(a)
Interpretation: The number of triple points in the given phase diagram of sulfur needs to be determined.
Concept Introduction:
The conversion of
The heating -cooling curve is the curve of temperature v/s time that interpret the change in the states of matter with increase in temperature.
The phase diagram represents the change in the physical state of given substance with temperature and pressure.
(a)
Answer to Problem 104E
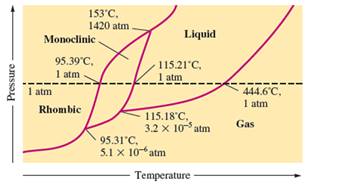
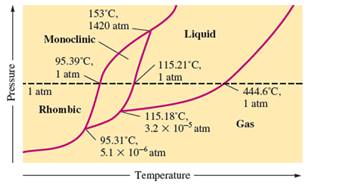
There are three triple points in the given phase diagram of sulfur.
Explanation of Solution
A triple point is the point in the phase diagram at which all the three phases will join together. It indicates the point (temperature and pressure) at which all three states remain in equilibrium.

(b)
Interpretation: The phases at the triple points in the given phase diagram of sulfur needs to be determined.

Concept Introduction:
The conversion of solid to liquid and gas involves the change in temperature that can display in heat curve.
The heating -cooling curve is the curve of temperature v/s time that interpret the change in the states of matter with increase in temperature.
The phase diagram represents the change in the physical state of given substance with temperature and pressure.
(b)
Answer to Problem 104E
- At 95.31°C: rhombic, monoclinic, gas
- At 115.18°C: monoclinic, liquid, gas
- At 153°C: rhombic, monoclinic, and liquid
Explanation of Solution
A triple point is the point in the phase diagram at which all the three phases will join together. It indicates the point (temperature and pressure) at which all three states remain in equilibrium.
At 95.31°C, the rhombic, monoclinic and gaseous state of sulfur are in equilibrium whereas at 115.18°C monoclinic, liquid and gaseous state of sulfur. The 3rd triple point is at 153°C at which rhombic, monoclinic, and liquid state of sulfur.
(c)
Interpretation: The phases which are stable at room temperature and 1.0 atm pressure in the given phase diagram of sulfur needs to be determined.
Concept Introduction:
The conversion of solid to liquid and gas involves the change in temperature that can display in heat curve.
The heating -cooling curve is the curve of temperature v/s time that interpret the change in the states of matter with increase in temperature.
The phase diagram represents the change in the physical state of given substance with temperature and pressure.
(c)
Answer to Problem 104E
At room temperature and 1.0 atm pressure,the rhombic phase of sulfur is stable. The temperature is approximately ˜ 20°C and pressure is 1.0 atm.
Explanation of Solution
In the given phase diagram, there are four states of sulfur; monoclinic, rhombic, liquid and gaseous state of sulfur.
At room temperature and 1.0 atm pressure, the rhombic phase of sulfur is stable. The temperature is approximately ˜ 20°C and pressure is 1.0 atm.
(d)
Interpretation: The possibility of existence of monoclinic sulfur in equilibrium with sulfur vapor needs to be determined.

Concept Introduction:
The conversion of solid to liquid and gas involves the change in temperature that can display in heat curve.
The heating -cooling curve is the curve of temperature v/s time that interpret the change in the states of matter with increase in temperature.
The phase diagram represents the change in the physical state of given substance with temperature and pressure.
(d)
Answer to Problem 104E
The monoclinic sulfur and vapor or gaseous state of matter share the phase line therefore they can be in equilibrium in the phase diagram.
Explanation of Solution
In the given phase diagram, there are four states of sulfur; monoclinic, rhombic, liquid and gaseous state of sulfur. The monoclinic sulfur and vapor or gaseous state of matter share the phase line therefore they can be in equilibrium in the phase diagram.
(e)
Interpretation: The normal boiling point and normal melting point of sulfur according to given phase diagram needs to be determined.

Concept Introduction:
The conversion of solid to liquid and gas involves the change in temperature that can display in heat curve.
The heating -cooling curve is the curve of temperature v/s time that interpret the change in the states of matter with increase in temperature.
The phase diagram represents the change in the physical state of given substance with temperature and pressure.
(e)
Answer to Problem 104E
Normal melting point = 115.21°C
Normal boiling point = 444.6°C
Explanation of Solution
In the given phase diagram, there are four states of sulfur; monoclinic, rhombic, liquid and gaseous state of sulfur. Boiling point is the temperature at which liquid and gaseous state remain in equilibrium at 1 atm pressure. According to given phase diagram, the normal boiling point of sulfur must be 444.6°C. The melting point of substance is the temperature at which solid melts to liquid state which is 115.21 °C for sulfur.
(f)
Interpretation: The denser phase out of solid, monoclinic or rhombic sulfur according to given phase diagram needs to be determined.

Concept Introduction:
The conversion of solid to liquid and gas involves the change in temperature that can display in heat curve.
The heating -cooling curve is the curve of temperature v/s time that interpret the change in the states of matter with increase in temperature.
The phase diagram represents the change in the physical state of given substance with temperature and pressure.
(f)
Answer to Problem 104E
Rhombic sulfur is the densest phase of sulfur.
Explanation of Solution
In the given phase diagram, there are four states of sulfur; monoclinic, rhombic, liquid and gaseous state of sulfur. The Rhombic phase of sulfur is most dense phase of it compare to monoclinic and solid. This is because the rhombic-monoclinic equilibrium line has a positive slope therefore with increase in the temperature, the rhombic phase changes to monoclinic.

Want to see more full solutions like this?
Chapter 16 Solutions
EBK CHEMICAL PRINCIPLES


- What is the stepwise mechanism for this reaction?arrow_forward32. Consider a two-state system in which the low energy level is 300 J mol 1 and the higher energy level is 800 J mol 1, and the temperature is 300 K. Find the population of each level. Hint: Pay attention to your units. A. What is the partition function for this system? B. What are the populations of each level? Now instead, consider a system with energy levels of 0 J mol C. Now what is the partition function? D. And what are the populations of the two levels? E. Finally, repeat the second calculation at 500 K. and 500 J mol 1 at 300 K. F. What do you notice about the populations as you increase the temperature? At what temperature would you expect the states to have equal populations?arrow_forward30. We will derive the forms of the molecular partition functions for atoms and molecules shortly in class, but the partition function that describes the translational and rotational motion of a homonuclear diatomic molecule is given by Itrans (V,T) = = 2πmkBT h² V grot (T) 4π²IKBT h² Where h is Planck's constant and I is molecular moment of inertia. The overall partition function is qmolec Qtrans qrot. Find the energy, enthalpy, entropy, and Helmholtz free energy for the translational and rotational modes of 1 mole of oxygen molecules and 1 mole of iodine molecules at 50 K and at 300 K and with a volume of 1 m³. Here is some useful data: Moment of inertia: I2 I 7.46 x 10- 45 kg m² 2 O2 I 1.91 x 101 -46 kg m²arrow_forward
- K for each reaction step. Be sure to account for all bond-breaking and bond-making steps. HI HaC Drawing Arrows! H3C OCH3 H 4 59°F Mostly sunny H CH3 HO O CH3 'C' CH3 Select to Add Arrows CH3 1 L H&C. OCH3 H H H H Select to Add Arrows Q Search Problem 30 of 20 H. H3C + :0: H CH3 CH3 20 H2C Undo Reset Done DELLarrow_forwardDraw the principal organic product of the following reaction.arrow_forwardCurved arrows are used to illustrate the flow of electrons. Using the provided structures, draw the curved arrows that epict the mechanistic steps for the proton transfer between a hydronium ion and a pi bond. Draw any missing organic structures in the empty boxes. Be sure to account for all lone-pairs and charges as well as bond-breaking and bond-making steps. 2 56°F Mostly cloudy F1 Drawing Arrows > Q Search F2 F3 F4 ▷11 H. H : CI: H + Undo Reset Done DELLarrow_forward
- Calculate the chemical shifts in 13C and 1H NMR for 4-chloropropiophenone ? Write structure and label hydrogens and carbons. Draw out the benzene ring structure when doing itarrow_forward1) Calculate the longest and shortest wavelengths in the Lyman and Paschen series. 2) Calculate the ionization energy of He* and L2+ ions in their ground states. 3) Calculate the kinetic energy of the electron emitted upon irradiation of a H-atom in ground state by a 50-nm radiation.arrow_forwardCalculate the ionization energy of He+ and Li²+ ions in their ground states. Thannnxxxxx sirrr Ahehehehehejh27278283-4;*; shebehebbw $+$;$-;$-28283773838 hahhehdvaarrow_forward
- Plleeaasseee solllveeee question 3 andd thankss sirr, don't solve it by AI plleeaasseee don't use AIarrow_forwardCalculate the chemical shifts in 13C and 1H NMR for 4-chloropropiophenone ? Write structure and label hydrogens and carbonsarrow_forwardPlease sirrr soollveee these parts pleaseeee and thank youuuuuarrow_forward
 Introductory Chemistry: A FoundationChemistryISBN:9781337399425Author:Steven S. Zumdahl, Donald J. DeCostePublisher:Cengage Learning
 Chemistry: Principles and PracticeChemistryISBN:9780534420123Author:Daniel L. Reger, Scott R. Goode, David W. Ball, Edward MercerPublisher:Cengage Learning
 ChemistryChemistryISBN:9781305957404Author:Steven S. Zumdahl, Susan A. Zumdahl, Donald J. DeCostePublisher:Cengage Learning
 Chemistry: An Atoms First ApproachChemistryISBN:9781305079243Author:Steven S. Zumdahl, Susan A. ZumdahlPublisher:Cengage Learning
 Chemistry: The Molecular ScienceChemistryISBN:9781285199047Author:John W. Moore, Conrad L. StanitskiPublisher:Cengage Learning