
Concept explainers
Videos
(a)
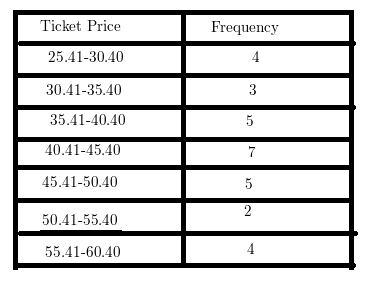
To Make:Frequency table for the data.
(a)
Answer to Problem 10PPS

Explanation of Solution
Given:The table shows the average ticket price to attend a game for each of the teams in the NHL.
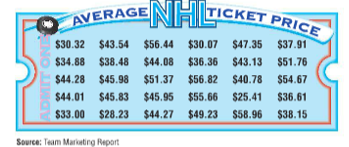
Select an appropriate interval for the data. Explain your reasoning. Then make a frequency table using he interval you selected.
Highest value =
Lowest value =
Range = Highest value − lowest value
Choosing the interval of
Thus the frequency table is shown below.
(b)
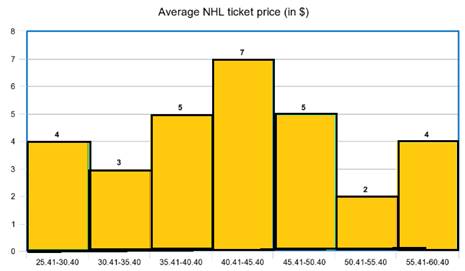
To Draw: The histogram of the given data.
(b)
Answer to Problem 10PPS

Explanation of Solution
Given:The table shows the average ticket price to attend a game for each of the teams in the NHL.

Construct the histogram of the data.
Steps:
- Draw and label the horizontal and vertical axis.
- Show the intervals from the frequency table.
- Draw a bar whose height is given by the frequency of each interval.
Chapter 13 Solutions
Pre-Algebra, Student Edition
Additional Math Textbook Solutions
Thinking Mathematically (6th Edition)
University Calculus: Early Transcendentals (4th Edition)
A First Course in Probability (10th Edition)
Basic Business Statistics, Student Value Edition
Elementary Statistics: Picturing the World (7th Edition)
Elementary Statistics


- 2) If Mand N be two water hyper Plane ofx Show that MUN and MN is hy Per Plane ofx with prove and Examplame. or 3) IS AUB is convex set and affine set or blensed set or symmetre setorsubsie.... Show that A and B is convex or affine or Hensedsed or symmetivce or subspace. 4) 18 MUN is independence show that Prove or ExPlane Mand Nave independend. or not. 5) Jet X be Vector Pace over I show that is xty tnx st Xty 3 fix→ F s-t f(x) (9) Jet Mand N be two blanced set of Xbe Vector space show tha MUNIS ansed setarrow_forwardFind a polynomial with integer coefficients that satisfies the given conditions. T(x) has degree 4, zeros i and 1 + i, and constant term 12.arrow_forwardHow to solve 2542000/64132 without a calculator?arrow_forward
- How much is the circumference of a circle whose diameter is 7 feet?C =π darrow_forwardHow to solve 2542/64.132arrow_forwardAssume that you fancy polynomial splines, while you actually need ƒ(t) = e²/3 – 1 for t€ [−1, 1]. See the figure for a plot of f(t). Your goal is to approximate f(t) with an inter- polating polynomial spline of degree d that is given as sa(t) = • Σk=0 Pd,k bd,k(t) so that sd(tk) = = Pd,k for tk = −1 + 2 (given d > 0) with basis functions bd,k(t) = Σi±0 Cd,k,i = • The special case of d 0 is trivial: the only basis function b0,0 (t) is constant 1 and so(t) is thus constant po,0 for all t = [−1, 1]. ...9 The d+1 basis functions bd,k (t) form a ba- sis Bd {ba,o(t), ba,1(t), bd,d(t)} of the function space of all possible sα (t) functions. Clearly, you wish to find out, which of them given a particular maximal degree d is the best-possible approximation of f(t) in the least- squares sense. _ 1 0.9 0.8 0.7 0.6 0.5 0.4 0.3 0.2 0.1 0 -0.1 -0.2 -0.3 -0.4 -0.5 -0.6 -0.7 -0.8 -0.9 -1 function f(t) = exp((2t)/3) - 1 to project -1 -0.9 -0.8 -0.7 -0.6 -0.5 -0.4 -0.3 -0.2 -0.1 0 0.1 0.2 0.3 0.4 0.5…arrow_forward
- An image processor considered a 750×750 pixels large subset of an image and converted it into gray-scale, resulting in matrix gIn - a false-color visualization of gIn is shown in the top-left below. He prepared a two-dim. box filter f1 as a 25×25 matrix with only the 5×5 values in the middle being non-zero – this filter is shown in the top-middle position below. He then convolved £1 with itself to get £2, before convolving £2 with itself to get f3. In both of the steps, he maintained the 25×25 size. Next, he convolved gIn with £3 to get gl. Which of the six panels below shows g1? Argue by explaining all the steps, so far: What did the image processor do when preparing ₤3? What image processing operation (from gin to g1) did he prepare and what's the effect that can be seen? Next, he convolved the rows of f3 with filter 1/2 (-1, 8, 0, -8, 1) to get f4 - you find a visualization of filter f 4 below. He then convolved gIn with f4 to get g2 and you can find the result shown below. What…arrow_forward3ur Colors are enchanting and elusive. A multitude of color systems has been proposed over a three-digits number of years - maybe more than the number of purposes that they serve... - Everyone knows the additive RGB color system – we usually serve light-emitting IT components like monitors with colors in that system. Here, we use c = (r, g, b) RGB with r, g, bЄ [0,1] to describe a color c. = T For printing, however, we usually use the subtractive CMY color system. The same color c becomes c = (c, m, y) CMY (1-c, 1-m, 1-y) RGB Note how we use subscripts to indicate with coordinate system the coordinates correspond to. Explain, why it is not possible to find a linear transformation between RGB and CMY coordinates. Farbenlehr c von Goethe Erster Band. Roſt einen Defte mit fergen up Tübingen, is et 3. Cotta'fden Babarblung. ISIO Homogeneous coordinates give us a work-around: If we specify colors in 4D, instead, with the 4th coordinate being the homogeneous coordinate h so that every actual…arrow_forwardCan someone provide an answer & detailed explanation please? Thank you kindly!arrow_forward
- Given the cubic function f(x) = x^3-6x^2 + 11x- 6, do the following: Plot the graph of the function. Find the critical points and determine whether each is a local minimum, local maximum, or a saddle point. Find the inflection point(s) (if any).Identify the intervals where the function is increasing and decreasing. Determine the end behavior of the graph.arrow_forwardGiven the quadratic function f(x) = x^2-4x+3, plot the graph of the function and find the following: The vertex of the parabola .The x-intercepts (if any). The y-intercept. Create graph also before solve.arrow_forwardwhat model best fits this dataarrow_forward
 Algebra and Trigonometry (6th Edition)AlgebraISBN:9780134463216Author:Robert F. BlitzerPublisher:PEARSON
 Contemporary Abstract AlgebraAlgebraISBN:9781305657960Author:Joseph GallianPublisher:Cengage Learning
 Linear Algebra: A Modern IntroductionAlgebraISBN:9781285463247Author:David PoolePublisher:Cengage Learning
 Algebra And Trigonometry (11th Edition)AlgebraISBN:9780135163078Author:Michael SullivanPublisher:PEARSON
 Introduction to Linear Algebra, Fifth EditionAlgebraISBN:9780980232776Author:Gilbert StrangPublisher:Wellesley-Cambridge Press
 College Algebra (Collegiate Math)AlgebraISBN:9780077836344Author:Julie Miller, Donna GerkenPublisher:McGraw-Hill Education