
Concept explainers
Videos
a.
To calculate: The season having a greater range of points.
a.
Answer to Problem 8PPS
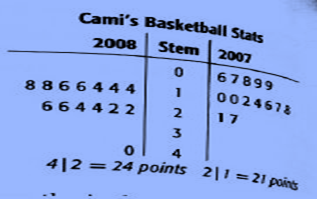
In 2008 Cami had a greater range of points.
Explanation of Solution
Given data:
The following data is given in the form of a stem and leaf diagram.
A stem and leaf model diagram can be studied for providing a large number of data in concise manner.
The central stem shows the number in tens place and the number on the side (leaf) show the number in units place. The total number of data gives the number of matches played or number of times Cami scored.
For example in 2007 season, she scored between 0 and 9 five times
Range of a sample of data refers to the difference between two extreme values (highest and lowest).
By looking at the sample it can be concluded that 2007 season had a range of
Whereas 2008 season had a range of
Conclusion:
Thus, Cami had a greater range of points in 2008 season which is 26.
b.
To find: An appropriate measure of central tendency for given two seasons.
b.
Answer to Problem 8PPS
Median is the appropriate measure of central tendency.
Explanation of Solution
Given data:
The following data is given in the form of a stem and leaf diagram.
Central tendency of a data indicates the most likely value from it.
There are certain types of measures depending on the nature of data.
2007 season has a simple data pattern without any skewed region.
Hence, mean or average will be the best measure of central tendency for 2007 season.
Mean for season 2007
2008 season has a bit different pattern because of an outlier (40).
Outlier is an unusually high or low value as compared to the majority of data.
For such a pattern mean will not be the best measure of central tendency, rather median will be a better measure.
If mean is used to find the central tendency of the given data it comes out to be 21,
However it should be noted that this is not the most likely score in 20008 season.
Mean comes out to be elevated by 2 because of an outlier as 40.
Although 2 is not a very big number but since Cami`s vary only by 1, 2 becomes valuable increase.
Median is obtained by simply finding out the middle value after arranging the data in ascending order.

The given data has an even number of value so the median can be found out by averaging the central 2 values.
Median
Conclusion:
Therefore, the median is appropriate measure of central tendency.
c.
To find: The effect on range of scores by including 40, which is an outlier.
c.
Answer to Problem 8PPS
It simply increases the error in mean of the data.
Explanation of Solution
Given data:
The following data is given in the form of a stem and leaf diagram.
40 in the 2008 season is an outlier.
Most of the scoring in 2008 season was in range of 14 to 26 that is a range of just 12.
By inclusion of 40 the range increase to 26, however here it must be noted that there are no points scored between 26 and 40 so adding 40, an outlier, would simply increase the error in mean or average of the data.
Chapter 13 Solutions
Pre-Algebra, Student Edition
Additional Math Textbook Solutions
Introductory Statistics
Thinking Mathematically (6th Edition)
University Calculus: Early Transcendentals (4th Edition)
Elementary Statistics
Basic Business Statistics, Student Value Edition
Algebra and Trigonometry (6th Edition)


- Assume that you fancy polynomial splines, while you actually need ƒ(t) = e²/3 – 1 for t€ [−1, 1]. See the figure for a plot of f(t). Your goal is to approximate f(t) with an inter- polating polynomial spline of degree d that is given as sa(t) = • Σk=0 Pd,k bd,k(t) so that sd(tk) = = Pd,k for tk = −1 + 2 (given d > 0) with basis functions bd,k(t) = Σi±0 Cd,k,i = • The special case of d 0 is trivial: the only basis function b0,0 (t) is constant 1 and so(t) is thus constant po,0 for all t = [−1, 1]. ...9 The d+1 basis functions bd,k (t) form a ba- sis Bd {ba,o(t), ba,1(t), bd,d(t)} of the function space of all possible sα (t) functions. Clearly, you wish to find out, which of them given a particular maximal degree d is the best-possible approximation of f(t) in the least- squares sense. _ 1 0.9 0.8 0.7 0.6 0.5 0.4 0.3 0.2 0.1 0 -0.1 -0.2 -0.3 -0.4 -0.5 -0.6 -0.7 -0.8 -0.9 -1 function f(t) = exp((2t)/3) - 1 to project -1 -0.9 -0.8 -0.7 -0.6 -0.5 -0.4 -0.3 -0.2 -0.1 0 0.1 0.2 0.3 0.4 0.5…arrow_forwardAn image processor considered a 750×750 pixels large subset of an image and converted it into gray-scale, resulting in matrix gIn - a false-color visualization of gIn is shown in the top-left below. He prepared a two-dim. box filter f1 as a 25×25 matrix with only the 5×5 values in the middle being non-zero – this filter is shown in the top-middle position below. He then convolved £1 with itself to get £2, before convolving £2 with itself to get f3. In both of the steps, he maintained the 25×25 size. Next, he convolved gIn with £3 to get gl. Which of the six panels below shows g1? Argue by explaining all the steps, so far: What did the image processor do when preparing ₤3? What image processing operation (from gin to g1) did he prepare and what's the effect that can be seen? Next, he convolved the rows of f3 with filter 1/2 (-1, 8, 0, -8, 1) to get f4 - you find a visualization of filter f 4 below. He then convolved gIn with f4 to get g2 and you can find the result shown below. What…arrow_forward3ur Colors are enchanting and elusive. A multitude of color systems has been proposed over a three-digits number of years - maybe more than the number of purposes that they serve... - Everyone knows the additive RGB color system – we usually serve light-emitting IT components like monitors with colors in that system. Here, we use c = (r, g, b) RGB with r, g, bЄ [0,1] to describe a color c. = T For printing, however, we usually use the subtractive CMY color system. The same color c becomes c = (c, m, y) CMY (1-c, 1-m, 1-y) RGB Note how we use subscripts to indicate with coordinate system the coordinates correspond to. Explain, why it is not possible to find a linear transformation between RGB and CMY coordinates. Farbenlehr c von Goethe Erster Band. Roſt einen Defte mit fergen up Tübingen, is et 3. Cotta'fden Babarblung. ISIO Homogeneous coordinates give us a work-around: If we specify colors in 4D, instead, with the 4th coordinate being the homogeneous coordinate h so that every actual…arrow_forward
- Can someone provide an answer & detailed explanation please? Thank you kindly!arrow_forwardGiven the cubic function f(x) = x^3-6x^2 + 11x- 6, do the following: Plot the graph of the function. Find the critical points and determine whether each is a local minimum, local maximum, or a saddle point. Find the inflection point(s) (if any).Identify the intervals where the function is increasing and decreasing. Determine the end behavior of the graph.arrow_forwardGiven the quadratic function f(x) = x^2-4x+3, plot the graph of the function and find the following: The vertex of the parabola .The x-intercepts (if any). The y-intercept. Create graph also before solve.arrow_forward
- what model best fits this dataarrow_forwardRound as specified A) 257 down to the nearest 10’s place B) 650 to the nearest even hundreds, place C) 593 to the nearest 10’s place D) 4157 to the nearest hundreds, place E) 7126 to the nearest thousand place arrow_forwardEstimate the following products in two different ways and explain each method  A) 52x39 B) 17x74 C) 88x11 D) 26x42arrow_forward
 Algebra and Trigonometry (6th Edition)AlgebraISBN:9780134463216Author:Robert F. BlitzerPublisher:PEARSON
 Contemporary Abstract AlgebraAlgebraISBN:9781305657960Author:Joseph GallianPublisher:Cengage Learning
 Linear Algebra: A Modern IntroductionAlgebraISBN:9781285463247Author:David PoolePublisher:Cengage Learning
 Algebra And Trigonometry (11th Edition)AlgebraISBN:9780135163078Author:Michael SullivanPublisher:PEARSON
 Introduction to Linear Algebra, Fifth EditionAlgebraISBN:9780980232776Author:Gilbert StrangPublisher:Wellesley-Cambridge Press
 College Algebra (Collegiate Math)AlgebraISBN:9780077836344Author:Julie Miller, Donna GerkenPublisher:McGraw-Hill Education