
Concept explainers
Videos
i.
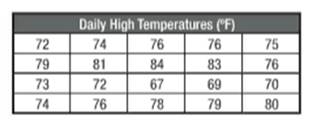
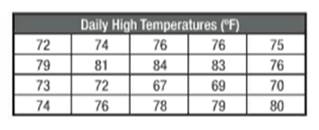
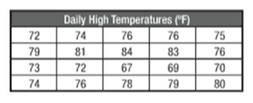
Show below data in stem and leaf plot.
i.
Answer to Problem 13STP
Stem and leaf plot for given data is,
| Stem | Leaf |
| 6 | 7 9 |
| 7 | 2 4 6 6 5 9 6 3 2 0 4 6 8 9 |
| 8 | 1 4 3 0 |
Explanation of Solution
Given:

Calculations:
Here, we have given stem and leaf plot for given set of data.
A stem and leaf plot is similar to bar graph.
Stem is the first digit of any number and leaf is the last digit of any number.
Now, stem and leaf plot for given high temperatures over 20 days period is,
| Stem | Leaf |
| 6 | 7 9 |
| 7 | 2 4 6 6 5 9 6 3 2 0 4 6 8 9 |
| 8 | 1 4 3 0 |
Conclusion:
Therefore, we are able to show stem and leaf plot for given set of data.
ii.
Calculate the range for daily high temperatures over 20 days.
ii.
Answer to Problem 13STP
Range for daily high temperatures over 20 days is
Explanation of Solution
Given:

Calculations:
Here, we have to draw stem and leaf plot for given set of data.
A stem and leaf plot is similar to bar graph.
Stem is the first digit of any number and leaf is the last digit of any number.
Stem and leaf plot for given high temperatures over 20 days period is,
| Stem | Leaf |
| 6 | 7 9 |
| 7 | 2 4 6 6 5 9 6 3 2 0 4 6 8 9 |
| 8 | 1 4 3 0 |
Range for given temperatures can be calculated by,
Conclusion:
Therefore, we are able to calculate range for given temperature.
iii.
Make a conclusions on given set of data for daily high temperatures over 20 days.

iii.
Answer to Problem 13STP
According to Stem and leaf plot for given data, 67 is the lowest and 84 is the largest temperature.
Explanation of Solution
Given:
Calculations:
Here, we have drawn stem and leaf plot for given set of data.
A stem and leaf plot is similar to bar graph.
Stem is the first digit of any number and leaf is the last digit of any number.
Stem and leaf plot for given high temperatures over 20 days period is,
| Stem | Leaf |
| 6 | 7 9 |
| 7 | 2 4 6 6 5 9 6 3 2 0 4 6 8 9 |
| 8 | 1 4 3 0 |
Range for given temperatures can be calculated by taking difference between higher and lower value among the set of data.
The lowest value in the data is 67 and the largest value is 84.
76 is the most frequent value and 84 is the outlier.
Conclusion:
Therefore, we are able to make conclusions about given set of data.
Chapter 13 Solutions
Pre-Algebra, Student Edition
Additional Math Textbook Solutions
Elementary Statistics
A First Course in Probability (10th Edition)
Basic Business Statistics, Student Value Edition
Elementary Statistics (13th Edition)
Elementary Statistics: Picturing the World (7th Edition)


- Consider the table of values below. x y 2 64 3 48 4 36 5 27 Fill in the right side of the equation y= with an expression that makes each ordered pari (x,y) in the table a solution to the equation.arrow_forwardsolving for xarrow_forwardConsider the table of values below. x y 2 63 3 70 4 77 5 84 Fill in the right side of the equation y= with an expression that makes each ordered pari (x,y) in the table a solution to the equation.arrow_forward
- There were 426 books sold in one week. The number of biology books sold was 5 times that of the number of psychology books. How many books each were sold?arrow_forwardPopulation decreases 5% each year. Starts with a starting population of 3705. Find that population after 5 years.arrow_forwardsolve using substitution -2x-3y=-15 -3x+9y=12arrow_forward
- Suppose that 7000 is placed in an accout that pays 4% interest. Interest compunds each year. Assume that no withdraws are made. How much would the account have after 1 year? And how much would the account have after 2 years?arrow_forwardUse substitution to solve the equations -2x+5y=18 x=2y-8arrow_forward5) For each function represented by an equation, make a table and plot the corresponding points to sketch the graph of the function. (a) y = 75 ()* 220 X y 200- -2 180 160 -1 140 0 120 100 1 60 80 2 3 4 x (b) y = 20 ()* 1 60 40 20 20 0 2 3 65- -1 X y 60 -2 55- 50 45 44 40 0 35- 30 1 25 2 20 20 15 3 10 5 LO 4 3-2 T -1 0 5- 4- -3- 2-arrow_forward
- A system of inequalities is shown. y 5 3 2 1 X -5 -4 -3 -2 -1 0 1 2 3 4 5 -1- Which system is represented in the graph? Oy>-x²-x+1 y 2x²+3 -2 -3 тarrow_forwardWhich set of systems of equations represents the solution to the graph? -5 -4 -3 -2 Of(x) = x² + 2x + 1 g(x) = x²+1 f(x) = x²+2x+1 g(x) = x²-1 f(x) = −x² + 2x + 1 g(x) = x²+1 f(x) = x² + 2x + 1 g(x) = x²-1 -1 5 y 4 3 2 1 0 -1- -2 -3- -4. -5 1 2 3 4 5arrow_forwardWhich of the graphs below correctly solves for x in the equation -x² - 3x-1=-x-4? о 10 8 (0,2) -10 -8 -6 -2 2 4 6 8 10 (-4,-2) -2 + (0,2) (4,6) -10-8-6-4-2 -2 2 4 6 8 10 (-3, -1) -2 2 (1-5) -6 -8 -10 10 -10-8-6-4-2 2 6 8 10 (2,0)arrow_forward
 Algebra and Trigonometry (6th Edition)AlgebraISBN:9780134463216Author:Robert F. BlitzerPublisher:PEARSON
 Contemporary Abstract AlgebraAlgebraISBN:9781305657960Author:Joseph GallianPublisher:Cengage Learning
 Linear Algebra: A Modern IntroductionAlgebraISBN:9781285463247Author:David PoolePublisher:Cengage Learning
 Algebra And Trigonometry (11th Edition)AlgebraISBN:9780135163078Author:Michael SullivanPublisher:PEARSON
 Introduction to Linear Algebra, Fifth EditionAlgebraISBN:9780980232776Author:Gilbert StrangPublisher:Wellesley-Cambridge Press
 College Algebra (Collegiate Math)AlgebraISBN:9780077836344Author:Julie Miller, Donna GerkenPublisher:McGraw-Hill Education