
Concept explainers
Videos
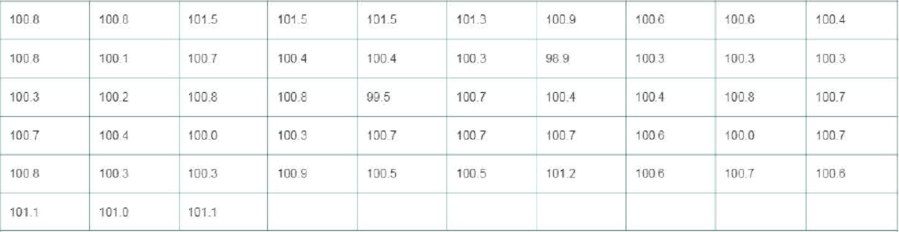
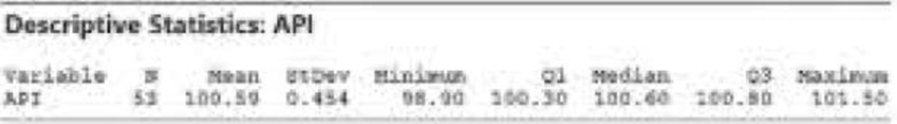
Active pharmaceutical ingredient. During the development of a new drug. pharmaceutical companies monitor the drug's active pharmaceutical ingredient (API). An article published in Organic Process Research & Development (July 2013) demonstrated the use of an individual control chart (x-chart) for this purpose. The data in the table represent API values for 53 consecutive batches of the new drug. (Note: Read across rows for consecutive API - measurements.) A Minitab printout with
- a. Locate the
mean and standard deviation of the sample data on the printout. - b. Use the mean and standard deviation to find the center line and the upper and lower control limits for an x-chart of the data, as in Example 13.3” (p. 13-15).
- c. Plot the data in an x-chart Is the process in control? No
Source: Based on K. Mukundam el al., “1-MR Control Chart: A Tool for Judging the Health of the Current Manufacturing Process of an API and for Setting the Trial Control Limits in Phase I of the Process Improvement.” Organic Procesa Research A Development. Vol. 17. July 2013 (Table 3).
Want to see the full answer?
Check out a sample textbook solution
Chapter 13 Solutions
Statistics for Business and Economics (13th Edition)


- pls help ASAParrow_forwardIs it possible to predict the annual number of business bankruptcies by the number of firm births (business starts) in the United States? The following data published by the U.S. Small Business Administration, Office of Advocacy, are pairs of the number of business bankruptcies (1,000s) and the number of firm births (10,000s) for a six-year period. Business Bankruptcies (1,000) 34.3 Firm Births (10,000) 58.1 35.0 55.4 38.5 57.0 40.1 58.5 35.5 57.4 37.9 58.0 i) Based on the output given, use these data to develop the equation of the regression model to predict the number of business bankruptcies by the number of firm births. ii) Explain the values of r and r. iii) Predict the number of business bankruptcies if the number of firm births is 54.0 (10,000s). iv) Do the data support the existence of a linear relationship between the number of firm births and the number of business bankruptcies? Test using a = 0.05. OUTPUT Model Summary Std. Error of the Estimate Adusted R Model R R Square…arrow_forwardAre cigarettes bad for people? Cigarette smoking involves tar, carbonmonoxide, and nicotine. The first two are definitely not good for aperson's health, and the last ingredient can cause addiction, refer to Table 2-16, which was taken from the web site maintained by the Journal of Statistics Education. For more information, visit the web site of the Journal of Statistics Education. Follow the links to the cigarette data. Health: Cigarette Smoke Use the data in Table 2-16 to make a stem-and-leaf display for milligrams of carbon monoxide per cigarette smoked.Are there any outliers?arrow_forward
- Indicate the dependent and independent variables, the number of levels for each independent variable, and whether each variable is within-subjects or between subjects 1. Individuals with anorexia and individuals with bulimia take a cognitive distortions test upon entering a treatment program for eating disorders and again three weeks later.arrow_forwardAbsenteeism: Absenteeism can be a serious employment problem. It is estimated that absenteeism reduces potential output by more than 10%. Two economists launched a research project to learn more about the problem. They randomly selected 100 organizations to participate in a 1-year study. For each organization, they recorded the average number of days absent per employee and several variables thought to affect absenteeism. Management’s goal here is to analyze the data and determine which factors may be helpful in predicting absenteeism. Perform a two-sample t-test analysis to determine if mean absenteeism is different between organizations which have a good Union management and those that do not. I have provided the F-test for two variances below: Copy and paste the Two sample t-test output below AND provide a clear conclusion supported by key statistics in the output about how absenteeism is affected by the Union Management Relationship. (I just need to know how to perform the two…arrow_forwardAbsenteeism: Absenteeism can be a serious employment problem. It is estimated that absenteeism reduces potential output by more than 10%. Two economists launched a research project to learn more about the problem. They randomly selected 100 organizations to participate in a 1-year study. For each organization, they recorded the average number of days absent per employee and several variables thought to affect absenteeism. Management’s goal here is to analyze the data and determine which factors may be helpful in predicting absenteeism. Now let us build a model to predict absenteeism based on key independent variables available in this dataset; wage, PctPT, PctU, Av Shift and U/MRel. Correlation matrix is provided below. Why are the variables AvShift and U/MRel excluded from this correlation matrix? Which variable in the matrix is likely to provide the best simple linear regression model and why? Does the correlation matrix show any evidence of collinearity? Explain. Data:…arrow_forward
- Absenteeism: Absenteeism can be a serious employment problem. It is estimated that absenteeism reduces potential output by more than 10%. Two economists launched a research project to learn more about the problem. They randomly selected 100 organizations to participate in a 1-year study. For each organization, they recorded the average number of days absent per employee and several variables thought to affect absenteeism. Management’s goal here is to analyze the data and determine which factors may be helpful in predicting absenteeism. Now let us build a model to predict absenteeism based on key independent variables available in this dataset; wage, PctPT, PctU, Av Shift and U/MRel The following down below is the correlation matrix between absenteeism and potential independent variables. Why are the variables AvShift and U/MRel excluded from this correlation matrix? Which variable in the matrix is likely to provide the best simple linear regression model and why? Does the…arrow_forwardUnited Dairies, Inc., supplies milk to several independent grocers throughout Dade County, Florida. Managers at United Dairies want to develop a forecast of the number of half-gallons of milk sold per week. Sales data for the past 12 weeks follow and have been transferred in the data file UDFMilk.xlsx download(also posted under week 11 module). Week Sales Week Sales 1 2750 7 3300 2 3100 8 3100 3 3250 9 2950 4 2800 10 3000 5 2900 11 3200 6 3050 12 3150 By Thursday, April 15 (11:55pm PST), answer the following 2 questions and attach a word doc or excel file to show your work. Use the data in the file UDFMilk.xlsx downloadto construct a time series plot. What type of pattern exists in the data? Use exponential smoothing with to develop a forecast of demand for week 13.arrow_forwardA psychologist believes that the age of an adolescent will have an impact on the number of phone calls made to the opposite sex (in heterosexual people) over the course of one month. They also suspect that gender of the adolescent will have an impact on the number of phone calls made to the opposite sex. Using the hypothetical data provided below, run your analyses in R to test whether age and gender impacts the number of phone calls an adolescent makes. Gender (Binary) Girl Boy Age Young Adolescents (11-14) 7, 2, 3, 5, 3 1, 2, 3, 2, 1 Older Adolescents (15-18) 15, 26, 19, 21, 18 10, 8, 5, 16, 9 ( What kind of statistical analysis do you need to use and why? State the null and alternative hypotheses. Check your assumptions. Include screenshots of your R output and explain why each of them are or are not met. Using R, run your analysis and include a screenshot. Using R, run post-hoc tests and include a screenshot. What do you…arrow_forward
- You may need to use the appropriate technology to answer this question. An automobile dealer conducted a test to determine if the time in minutes needed to complete a minor engine tune-up depends on whether a computerized engine analyzer or an electronic analyzer is used. Because tune-up time varies among compact, intermediate, and full-sized cars, the three types of cars were used as blocks in the experiment. The data obtained follow. Analyzer computerized electronic Car compact 50 41 Intermediate 56 45 Full Sized 62 46 Use ? = 0.05 to test for any significant differences. State the null and alternative hypotheses. H0: ?Computerized = ?ElectronicHa: ?Computerized ≠ ?ElectronicH0: ?Computerized ≠ ?ElectronicHa: ?Computerized = ?Electronic H0: ?Computerized = ?Electronic = ?Compact = ?Intermediate = ?Full-sizedHa: Not all the population means are equal.H0: ?Compact = ?Intermediate = ?Full-sizedHa: ?Compact ≠ ?Intermediate ≠ ?Full-sizedH0:…arrow_forwardThe data used is from college campuses. The variables used in the analysis below include: crime, total campus crime; enroll, total enrollment; police, employed officers. Use the estimated OLS models to answer the questions below: Model A: In(crime) = -6.631 + 1.270ln(enroll), (1.034) (.110) n = 97; R² = .5804 Model B: In(crime) = -4.794 + .923ln(enroll) (.144) (1.112) n = 97; R² = .632 +.516ln(police), (.149) Using Model A, test the null hypothesis that elasticity of crime with respect to enrollment is unit elastic, i.e. equal to one (against a two-sided alternative). Calculate the t-statistic.arrow_forwardYou may need to use the appropriate technology to answer this question. An automobile dealer conducted a test to determine if the time in minutes needed to complete a minor engine tune-up depends on whether a computerized engine analyzer or an electronic analyzer is used. Because tune-up time varies among compact, intermediate, and full-sized cars, the three types of cars were used as blocks in the experiment. The data obtained follow. Analyzer Computerized Electronic Compact 50 41 Car Intermediate 54 44 Full-sized 64 47 Use a = 0.05 to test for any significant differences. State the null and alternative hypotheses. O Ho: MCompact = "Intermediate = HFull-sized H: "Compact * "Intermediate * "Full-sized O Ho: "Compact * "Intermediate * HFull-sized H: "Compact "Intermediate = "Full-sized O Ho: Computerized = HElectronic H: "Computerized * HElectronic O Ho: "Computerized = HElectronic = "Compact = Intermediate = Full-sized H: Not all the population means are equal. O Ho: HComputerized *…arrow_forward
 Glencoe Algebra 1, Student Edition, 9780079039897...AlgebraISBN:9780079039897Author:CarterPublisher:McGraw Hill
 Big Ideas Math A Bridge To Success Algebra 1: Stu...AlgebraISBN:9781680331141Author:HOUGHTON MIFFLIN HARCOURTPublisher:Houghton Mifflin Harcourt
 Linear Algebra: A Modern IntroductionAlgebraISBN:9781285463247Author:David PoolePublisher:Cengage Learning
 Holt Mcdougal Larson Pre-algebra: Student Edition...AlgebraISBN:9780547587776Author:HOLT MCDOUGALPublisher:HOLT MCDOUGAL