
Statistics for Business and Economics (13th Edition)
13th Edition
ISBN: 9780134506593
Author: James T. McClave, P. George Benson, Terry Sincich
Publisher: PEARSON
expand_more
expand_more
format_list_bulleted
Concept explainers
Videos
Textbook Question
Chapter 13.5, Problem 13.36ACI
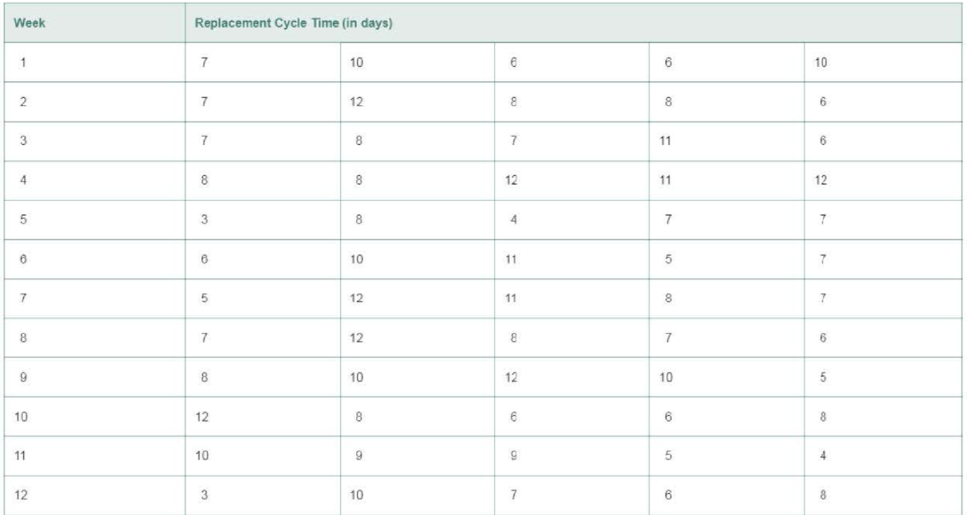
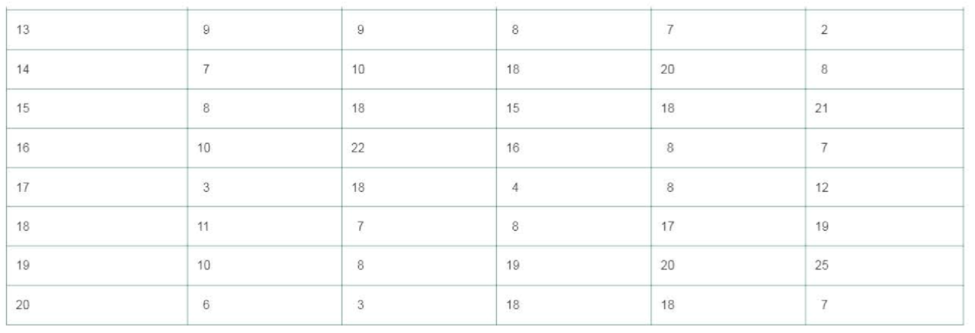
Replacement times for lost ATM cards. In an effort to reduce customer dissatisfaction with delays in replacing lost automated teller machine (ATM) cards, some retail banks monitor the time required to replace a lost ATM card. Called replacement cycle time, it is the elapsed time from when the customer contacts the bank about the loss until the customer receives a new card (Management Science. Sept. 1999). A particular retail bank monitors replacement cycle time for the first five requests each week for replacement cards. Variation in cycle times is monitored using an R-chart. Data for 20 weeks are presented below.
- a. Construct an R-chart for these data.
- b. What does the R-chart suggest about the presence of special causes of variation in the process?
- c. Should the control limits of your R-chart be used to monitor future replacement cycle times? Explain.
- d. Given your conclusion in part b and the pattern displayed on the R-chart. discuss the possible future impact on the performance of the bank.
Expert Solution & Answer
Want to see the full answer?
Check out a sample textbook solution
Students have asked these similar questions
The percentage of employees who cease their employment during a year is referred to as employee turnover, and it is a serious issue for businesses. The following table shows the cost, in millions of dollars, to a certain company for a given employee turnover percentage in a year.
Credit Data, Inc., has been monitoring the amount of time its bill collectors spend on calls that produce contacts with consumers. Management is interested in the distribution of time a collector spends on each call in which he or she initiates contact, informs a consumer about an outstanding debt, discusses a payment plan, and receives payments by phone. Credit Data is mostly interested in how quickly a collector can initiate and end a conversation to move on to the next call. For employees of Credit Data, time is money in the sense that one account may require one call and 3 minutes to collect, whereas another account may take five calls and 11 minutes per call to collect. The company has discovered that the time collectors spend talking to consumers about accounts is approximated by a normal distribution with a mean of 9 minutes and a standard deviation of 2.5 minutes. The managers believe that the mean is too high and should be reduced by more efficient phone call methods.…
Determine whether an observational or experimental study is appropriate to address the following statement.
A general manager of a restaurant wants to study if her customer base is shrinking.
Chapter 13 Solutions
Statistics for Business and Economics (13th Edition)
Ch. 13.4 - What is a control chart? Describe its use.Ch. 13.4 - Explain why rational subgrouping should be used in...Ch. 13.4 - When a control chart is first constructed, why are...Ch. 13.4 - Which process parameter is an x -chart used to...Ch. 13.4 - Even if all the points on an x -chart fall between...Ch. 13.4 - What must be true about the variation of a process...Ch. 13.4 - Use the six pattern-analysis rules described in...Ch. 13.4 - Consider the x -chart shown below. a. Is the...Ch. 13.4 - Use Table IX on page 13-74 to find the value of A2...Ch. 13.4 - Twenty-five consecutive samples of size n = 5 were...
Ch. 13.4 - The data in the following table were collected for...Ch. 13.4 - Prob. 13.12ACBCh. 13.4 - Active pharmaceutical ingredient. During the...Ch. 13.4 - Detecting gender-related employment disparities....Ch. 13.4 - Pain levels of ICU patients. Various interventions...Ch. 13.4 - Quality control for irrigation data. Most farmers...Ch. 13.4 - Improving public health waiting times. Statistical...Ch. 13.4 - Cereal box manufacturing. A machine at K-Company...Ch. 13.4 - Detecting under-reported emissions. The...Ch. 13.4 - 13 20 Selecting the best wafer-slicing machine....Ch. 13.4 - Chunky data. BPI Consulting, a leading provider of...Ch. 13.4 - Military aircraft bolts. A precision parts...Ch. 13.5 - What characteristic of a process is an R-chart...Ch. 13.5 - Prob. 13.24LMCh. 13.5 - Use Table IX on page 13-74 to find the values of...Ch. 13.5 - Construct and interpret an R-chart for the data in...Ch. 13.5 - Construct and interpret an R-chart for the data in...Ch. 13.5 - Construct and interpret an R-chart and an x -chart...Ch. 13.5 - Weight of packed frozen scallops. In Quality...Ch. 13.5 - Detecting gender-related employment disparities....Ch. 13.5 - Pain levels of ICU patients. Refer to the Research...Ch. 13.5 - Quality control for irrigation data. Refer to...Ch. 13.5 - Lowering the thickness of an expensive blow-molded...Ch. 13.5 - Cola bottle filling process. A soft-drink bottling...Ch. 13.5 - Chunky data. Refer to Exercise 13.21e (p. 13-40)...Ch. 13.5 - Replacement times for lost ATM cards. In an effort...Ch. 13.5 - Military aircraft bolts. Refer to the...Ch. 13.5 - Precision of scale weight measurements. The...Ch. 13.6 - What characteristic of a process is a p-chart...Ch. 13.6 - In each of the following cases, use the sample...Ch. 13.6 - The proportion of defective items generated by a...Ch. 13.6 - To construct a p-chart for a manufacturing...Ch. 13.6 - To construct a p-chart, 20 samples of size 150...Ch. 13.6 - Academic failure rates in Nigeria. The quality...Ch. 13.6 - Monitoring surgery complications. An article on...Ch. 13.6 - Rental car call center study. A worldwide rental...Ch. 13.6 - Defective micron chips. A manufacturer produces...Ch. 13.6 - Hand break cable defects. In Control Engineering...Ch. 13.6 - Monitoring newspaper typesetters. Accurate...Ch. 13.6 - Quality of rewritable CDs. A Japanese compact disc...Ch. 13.6 - Leaky process pumps. Quality (February 2008)...Ch. 13.6 - Rubber company lire tests. Goodstone Tire Rubber...Ch. 13.7 - Explain why it is inappropriate to conduct a...Ch. 13.7 - Explain the difference between process spread and...Ch. 13.7 - Describe two different ways to assess the...Ch. 13.7 - Why is it recommended to use and interpret Cp in...Ch. 13.7 - For a process that is in control and follows a...Ch. 13.7 - Find the specification spread for each of the...Ch. 13.7 - Find (or estimate) the process spread for each of...Ch. 13.7 - Find the value of Cp for each of the following...Ch. 13.7 - Upper specification limit of a process. An...Ch. 13.7 - Capability of an in-control process. A process is...Ch. 13.7 - Water use at a thermal power plant. Thermal power...Ch. 13.7 - Cereal box filling process. Refer to the data on...Ch. 13.7 - Military aircraft bolts. Refer to Exercise 13.22...Ch. 13.7 - Bioreactor production of antibodies. Benchtop...Ch. 13.7 - Driver gear bore holes. During the manufacture of...Ch. 13.7 - Lowering the thickness of an expensive blow-molded...Ch. 13 - Define quality and list its important dimensions.Ch. 13 - What is a process? Give an example of an...Ch. 13 - What is a system? Give an example of a system with...Ch. 13 - Describe the six major sources of process...Ch. 13 - Suppose all the output of a process over the last...Ch. 13 - Processes that are in control are predictable;...Ch. 13 - Compare and contrast special and common causes...Ch. 13 - Explain the difference between control limits and...Ch. 13 - Should control charts be used to monitor a process...Ch. 13 - Under what circumstances is it appropriate to use...Ch. 13 - A process is under control and follows a normal...Ch. 13 - Weight of a product. Consider the time series data...Ch. 13 - Lengths of pencils. The length measurements of 20...Ch. 13 - Applying pattern-analysis rules. Use the...Ch. 13 - Defective plastic mold. A company that...Ch. 13 - Robotics clamp gap width. Control chart...Ch. 13 - Package sorting time. AirExpress. an overnight...Ch. 13 - Waiting times of airline passengers. Officials at...Ch. 13 - Defects in graphite shafts. Over the last year, a...Ch. 13 - New iron-making process. Mining Engineering...Ch. 13 - CPU of a computer chip. The central processing...Ch. 13 - Bayfield Mud Company case. The text Quantitative...
Knowledge Booster


Learn more about
Need a deep-dive on the concept behind this application? Look no further. Learn more about this topic, statistics and related others by exploring similar questions and additional content below.Similar questions
- Please answer C. and D. Palisades Eco-Park is a small ecological reserve that admits a relatively small number of visitors on any day, but provides both educational and entertaining lectures, exhibitions, and opportunities to observe nature. The company has collected the following data on labor costs and number of visitors to the park over the last 30 months. Month Labor Cost Visitors 1 $ 25,820 1,700 2 $ 36,290 2,592 3 $ 39,968 2,811 4 $ 31,648 2,222 5 $ 34,809 2,373 6 $ 32,672 2,181 7 $ 32,023 2,205 8 $ 38,334 2,676 9 $ 38,568 2,760 10 $ 46,933 3,572 11 $ 42,157 2,976 12 $ 39,030 2,804 13 $ 34,444 2,415 14 $ 33,173 2,336 15 $ 36,971 2,508 16 $ 26,500 2,099 17 $ 30,663 3,397 18 $ 29,961 2,786 19 $ 27,590 2,412 20 $ 30,003 2,972 21 $ 25,692 2,000 22 $ 24,655 1,794 23 $ 28,892 3,267 24 $ 30,153 3,817 25 $ 28,119 2,592 26 $ 31,690 3,274 27 $ 28,651 2,989 28 $ 29,927 3,050 29 $ 28,438 2,511 30 $ 27,874 2,075…arrow_forwardHealthy Sleep Duration. The Centers for Disease Control and Prevention (CDC) define a healthy sleep duration to be at least seven hours per day. The CDC reports that the percentage of people who report a healthy sleep duration varies by marital status. The CDC also reports that in 2018, 67% of those who are married report a healthy sleep duration; 62% of those who have never been married report a healthy sleep duration; and 56% of those who are divorced, widowed, or separated report a healthy sleep duration. The file SleepHabits contains sample data on the sleeping habits of people who have never been married that are consistent with the CDC’s findings. Use these data to answer the following questions. Develop a point estimate and a 95% confidence interval for the proportion of those who have never been married who report a healthy sleep duration. Develop a point estimate and a 95% confidence interval for the mean number of hours of sleep for those who have never been married. For…arrow_forwardPart 2: The owner of a pet store is trying to decide whether to discontinue selling specialty clothes for pets. She suspects that only 4% of the customers buy specialty clothes for their pets and thinks that she might be able to replace the clothes with more interesting and profitable items on the shelves. Before making a final decision she decides to keep track of the total number of customers for a day, and whether they purchase specialty clothes for their pet. Assuming the pet store owner is correct in thinking that only 4% of her customers purchase specialty clothes for their pets, how many customers should she expect before someone buys a garment for their pet? l. 2. What is the probability that she does not sell a gament until the 7th customer? Show work. What is the probability that exactly 3 of the first 10 customers buy specialty clothes for their pet? Show work. 4. What is the probability that at least 3 of the first 40 customers buy specialty clothes for their pet? Show…arrow_forward
- An fruit grower knows from previous experience and careful data analysis that if the fruit on a specific kind of tree is harvested at this time of year, each tree will yield, on average, 127 pounds, and will sell for $4.6 per pound. However, for each additional week the harvest is delayed (up to a point), the yield per tree will increase by 2.1 pounds, while the price per pound will decrease by $0.07. A) How many weeks should the grower wait before harvesting the apples in order to maximize the sales revenue per tree? (Round your answer to the nearest tenth of a week.) Answer: __________ (rounded to the nearest tenth) B) Use your answer in part A to find the actual maximum revenue that can be expected. (Round your answer to the nearest dollar.) Answer: ____________ dollars (rounded to the nearest dollar)arrow_forwardUse the most accurate method to forecast the revenues of licenses, permits, and fees in Years 9, 10, and 11. Use the Year 8 actual figure instead of the forecast figure (Year 8 was $23,210,218). Also, consider three incremental changes in forecasting.arrow_forwardAn experimenter wants to study the relationship between type of milk and infant growth in underdeveloped countries. She randomly assigns 300 infants to either a breast-feeding group or an infant formula group. She then weighs the infants every three days for the first four weeks of life.arrow_forward
- South Shore Construction builds permanent docks and seawalls along the southern shore of Long Island, New York. Although the firm has been in business only five years, revenue has increased from $308,000 in the first year of operation to $1,084,000 in the most recent year. The following data show the quarterly sales revenue in thousands of dollars. O 8 Sales ($1,000s) Sales ($1,000s) Quarter Year 1 Year 2 Year 3 Year 3 37 75 Sales ($1,00 (a) Construct a time series plot. 500T 450- 500 450 1 2 3 400 350- 300+ 250 200+ 150- 100 50 50- 0 4 400 350- 300+ 250 200- 150+ 100- 0 50 5001 450 400 350 300+ 250 200- 150- 100 50 0 500- 450- 400- 350+ 300+ 250 200 150- 100+ 20 of 100 175 13 1 2 3 4 Year 1 1 2 3 4 Year 1 136 245 26 155 326 48 M Year 3 Year/Quarter Year Year 4 Year 5 4 92 202 384 1 2 3 41 2 3 4 1 2 341234 Year 2 Year 4 Year 5 82 1 2 3 4 1 2 3 4 1 2 3 4 1 2 3 4 Year 2 Year 4 Year 5 Year 3 Year/Quarter 282 1 2 3 4 1 2 341 2 3 4 1 2 341234 Year 1 Year 2 Year 3 Year 4 Year 5 Year/Quarter…arrow_forwardGive two examples ofdata collecting from day -to -day life.arrow_forwardNew legislation passed in 2017 by the U.S. Congress changed tax laws that affect how many people file their taxes in 2018 and beyond. These tax law changes will likely lead many people to seek tax advice from their accountants (The New York Times). Backen and Hayes LLC is an accounting firm in New York state. The accounting firm believes that it may have to hire additional accountants to assist with the increased demand in tax advice for the upcoming tax season. Backen and Hayes LLC has developed the following probability distribution for number of new clients seeking tax advice. x f(x) 20 0.05 25 0.20 30 0.25 35 0.15 40 0.15 45 0.10 50 0.10 b. What is the probability that Backen and Hayes LLC will obtain 40 or more new clients (to 2 decimals c. What is the probability that Backen and Hayes LLC will obtain fewer than 35 new clients (to 2 decimals)? d.Compute the expected value, variance, and standard deviation of (to 2 decimals). Expected value…arrow_forward
- Do you dislike waiting in line? Supermarket chain Kroger has used computer simulation and information technology to reduce the average waiting time for customers at 2300 stores. Using a new system called QueVision, which allows Kroger to better predict when shoppers will be checking out, the company was able to decrease average customer waiting time to just 26 seconds (InformationWeek website and The Wall StreetJournal website, January 5, 2015).a. Assume that Kroger waiting times are exponentially distributed. Show the probability density function of waiting time at Kroger.b. What is the probability that a customer will have to wait between 15 and 30 seconds?c. What is the probability that a customer will have to wait more than 2 minutes?arrow_forwardVacation destinations often run on a seasonal basis, depending on the primary activities in that location. Amanda Wang is the owner of a travel agency in Cincinnati, Ohio. She has built a database of the number of vacation packages (Vacation) that she has sold over the last 12 years. The accompanying file includes quarterly data on the number of vacation packages sold. Year Quarter Vacation 2008 1 500 2008 2 147 2008 3 1314 2008 4 673 2009 1 984 2009 2 584 2009 3 1449 2009 4 1125 2010 1 209 2010 2 458 2010 3 1357 2010 4 544 2011 1 483 2011 2 280 2011 3 1392 2011 4 780 2012 1 340 2012 2 1003 2012 3 1692 2012 4 783 2013 1 781 2013 2 409 2013 3 1657 2013 4 792 2014 1 671 2014 2 769 2014 3 1068 2014 4 520 2015 1 616 2015 2 775 2015 3 1215 2015 4 514 2016 1 232 2016 2 492 2016 3 1581 2016 4 1028 2017 1 551 2017 2 869 2017 3 1114 2017 4 476 2018 1 405 2018 2 412 2018 3 1121 2018 4 554 2019 1 666…arrow_forwardHelp please. I am extremely confused and do not understand this! Can I get help with all parts please?arrow_forward
arrow_back_ios
SEE MORE QUESTIONS
arrow_forward_ios
Recommended textbooks for you
 MATLAB: An Introduction with ApplicationsStatisticsISBN:9781119256830Author:Amos GilatPublisher:John Wiley & Sons Inc
 Probability and Statistics for Engineering and th...StatisticsISBN:9781305251809Author:Jay L. DevorePublisher:Cengage Learning
 Statistics for The Behavioral Sciences (MindTap C...StatisticsISBN:9781305504912Author:Frederick J Gravetter, Larry B. WallnauPublisher:Cengage Learning
 Elementary Statistics: Picturing the World (7th E...StatisticsISBN:9780134683416Author:Ron Larson, Betsy FarberPublisher:PEARSON
 The Basic Practice of StatisticsStatisticsISBN:9781319042578Author:David S. Moore, William I. Notz, Michael A. FlignerPublisher:W. H. Freeman
 Introduction to the Practice of StatisticsStatisticsISBN:9781319013387Author:David S. Moore, George P. McCabe, Bruce A. CraigPublisher:W. H. Freeman
MATLAB: An Introduction with Applications
Statistics
ISBN:9781119256830
Author:Amos Gilat
Publisher:John Wiley & Sons Inc
Probability and Statistics for Engineering and th...
Statistics
ISBN:9781305251809
Author:Jay L. Devore
Publisher:Cengage Learning
Statistics for The Behavioral Sciences (MindTap C...
Statistics
ISBN:9781305504912
Author:Frederick J Gravetter, Larry B. Wallnau
Publisher:Cengage Learning
Elementary Statistics: Picturing the World (7th E...
Statistics
ISBN:9780134683416
Author:Ron Larson, Betsy Farber
Publisher:PEARSON
The Basic Practice of Statistics
Statistics
ISBN:9781319042578
Author:David S. Moore, William I. Notz, Michael A. Fligner
Publisher:W. H. Freeman
Introduction to the Practice of Statistics
Statistics
ISBN:9781319013387
Author:David S. Moore, George P. McCabe, Bruce A. Craig
Publisher:W. H. Freeman
Mod-01 Lec-01 Discrete probability distributions (Part 1); Author: nptelhrd;https://www.youtube.com/watch?v=6x1pL9Yov1k;License: Standard YouTube License, CC-BY
Discrete Probability Distributions; Author: Learn Something;https://www.youtube.com/watch?v=m9U4UelWLFs;License: Standard YouTube License, CC-BY
Probability Distribution Functions (PMF, PDF, CDF); Author: zedstatistics;https://www.youtube.com/watch?v=YXLVjCKVP7U;License: Standard YouTube License, CC-BY
Discrete Distributions: Binomial, Poisson and Hypergeometric | Statistics for Data Science; Author: Dr. Bharatendra Rai;https://www.youtube.com/watch?v=lHhyy4JMigg;License: Standard Youtube License