
Statistics for Business and Economics (13th Edition)
13th Edition
ISBN: 9780134506593
Author: James T. McClave, P. George Benson, Terry Sincich
Publisher: PEARSON
expand_more
expand_more
format_list_bulleted
Concept explainers
Videos
Textbook Question
Chapter 13.5, Problem 13.29ACB
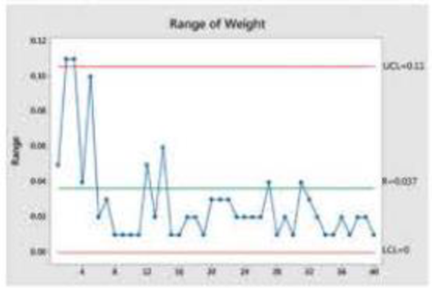
Weight of packed frozen scallops. In Quality Engineering (Vol. 28, No. 3, 2016), control charts were used to monitor the weight of frozen scallops packed at a marine products plant. During packing, the scallops are placed In plastic trays. The target total weight (scallops and plastic trays) is 2 kilograms. To monitor the packing process, the quality control department takes 5 samples of 5 plastic trays In the overnight shift every day and records the weight of each tray. An R-chart of weight for the first 40 samples is shown to the right.
- a. Identify the rational subgroups used to construct the R-chart.
- b. Is the process in control? If not, what do you recommend?
Expert Solution & Answer
Want to see the full answer?
Check out a sample textbook solution
Students have asked these similar questions
Solve for X. Explain each step.
2^2x • 2^-4=8
One hundred people were surveyed, and one question pertained to their educational background. The results of this question and their genders are given in the following table.
Female (F)
Male (F′)
Total
College degree (D)
30
20
50
No college degree (D′)
30
20
50
Total
60
40
100
If a person is selected at random from those surveyed, find the probability of each of the following events.1. The person is female or has a college degree. Answer:
equation editor
Equation Editor
2. The person is male or does not have a college degree. Answer:
equation editor
Equation Editor
3. The person is female or does not have a college degree.
need help with part b
Chapter 13 Solutions
Statistics for Business and Economics (13th Edition)
Ch. 13.4 - What is a control chart? Describe its use.Ch. 13.4 - Explain why rational subgrouping should be used in...Ch. 13.4 - When a control chart is first constructed, why are...Ch. 13.4 - Which process parameter is an x -chart used to...Ch. 13.4 - Even if all the points on an x -chart fall between...Ch. 13.4 - What must be true about the variation of a process...Ch. 13.4 - Use the six pattern-analysis rules described in...Ch. 13.4 - Consider the x -chart shown below. a. Is the...Ch. 13.4 - Use Table IX on page 13-74 to find the value of A2...Ch. 13.4 - Twenty-five consecutive samples of size n = 5 were...
Ch. 13.4 - The data in the following table were collected for...Ch. 13.4 - Prob. 13.12ACBCh. 13.4 - Active pharmaceutical ingredient. During the...Ch. 13.4 - Detecting gender-related employment disparities....Ch. 13.4 - Pain levels of ICU patients. Various interventions...Ch. 13.4 - Quality control for irrigation data. Most farmers...Ch. 13.4 - Improving public health waiting times. Statistical...Ch. 13.4 - Cereal box manufacturing. A machine at K-Company...Ch. 13.4 - Detecting under-reported emissions. The...Ch. 13.4 - 13 20 Selecting the best wafer-slicing machine....Ch. 13.4 - Chunky data. BPI Consulting, a leading provider of...Ch. 13.4 - Military aircraft bolts. A precision parts...Ch. 13.5 - What characteristic of a process is an R-chart...Ch. 13.5 - Prob. 13.24LMCh. 13.5 - Use Table IX on page 13-74 to find the values of...Ch. 13.5 - Construct and interpret an R-chart for the data in...Ch. 13.5 - Construct and interpret an R-chart for the data in...Ch. 13.5 - Construct and interpret an R-chart and an x -chart...Ch. 13.5 - Weight of packed frozen scallops. In Quality...Ch. 13.5 - Detecting gender-related employment disparities....Ch. 13.5 - Pain levels of ICU patients. Refer to the Research...Ch. 13.5 - Quality control for irrigation data. Refer to...Ch. 13.5 - Lowering the thickness of an expensive blow-molded...Ch. 13.5 - Cola bottle filling process. A soft-drink bottling...Ch. 13.5 - Chunky data. Refer to Exercise 13.21e (p. 13-40)...Ch. 13.5 - Replacement times for lost ATM cards. In an effort...Ch. 13.5 - Military aircraft bolts. Refer to the...Ch. 13.5 - Precision of scale weight measurements. The...Ch. 13.6 - What characteristic of a process is a p-chart...Ch. 13.6 - In each of the following cases, use the sample...Ch. 13.6 - The proportion of defective items generated by a...Ch. 13.6 - To construct a p-chart for a manufacturing...Ch. 13.6 - To construct a p-chart, 20 samples of size 150...Ch. 13.6 - Academic failure rates in Nigeria. The quality...Ch. 13.6 - Monitoring surgery complications. An article on...Ch. 13.6 - Rental car call center study. A worldwide rental...Ch. 13.6 - Defective micron chips. A manufacturer produces...Ch. 13.6 - Hand break cable defects. In Control Engineering...Ch. 13.6 - Monitoring newspaper typesetters. Accurate...Ch. 13.6 - Quality of rewritable CDs. A Japanese compact disc...Ch. 13.6 - Leaky process pumps. Quality (February 2008)...Ch. 13.6 - Rubber company lire tests. Goodstone Tire Rubber...Ch. 13.7 - Explain why it is inappropriate to conduct a...Ch. 13.7 - Explain the difference between process spread and...Ch. 13.7 - Describe two different ways to assess the...Ch. 13.7 - Why is it recommended to use and interpret Cp in...Ch. 13.7 - For a process that is in control and follows a...Ch. 13.7 - Find the specification spread for each of the...Ch. 13.7 - Find (or estimate) the process spread for each of...Ch. 13.7 - Find the value of Cp for each of the following...Ch. 13.7 - Upper specification limit of a process. An...Ch. 13.7 - Capability of an in-control process. A process is...Ch. 13.7 - Water use at a thermal power plant. Thermal power...Ch. 13.7 - Cereal box filling process. Refer to the data on...Ch. 13.7 - Military aircraft bolts. Refer to Exercise 13.22...Ch. 13.7 - Bioreactor production of antibodies. Benchtop...Ch. 13.7 - Driver gear bore holes. During the manufacture of...Ch. 13.7 - Lowering the thickness of an expensive blow-molded...Ch. 13 - Define quality and list its important dimensions.Ch. 13 - What is a process? Give an example of an...Ch. 13 - What is a system? Give an example of a system with...Ch. 13 - Describe the six major sources of process...Ch. 13 - Suppose all the output of a process over the last...Ch. 13 - Processes that are in control are predictable;...Ch. 13 - Compare and contrast special and common causes...Ch. 13 - Explain the difference between control limits and...Ch. 13 - Should control charts be used to monitor a process...Ch. 13 - Under what circumstances is it appropriate to use...Ch. 13 - A process is under control and follows a normal...Ch. 13 - Weight of a product. Consider the time series data...Ch. 13 - Lengths of pencils. The length measurements of 20...Ch. 13 - Applying pattern-analysis rules. Use the...Ch. 13 - Defective plastic mold. A company that...Ch. 13 - Robotics clamp gap width. Control chart...Ch. 13 - Package sorting time. AirExpress. an overnight...Ch. 13 - Waiting times of airline passengers. Officials at...Ch. 13 - Defects in graphite shafts. Over the last year, a...Ch. 13 - New iron-making process. Mining Engineering...Ch. 13 - CPU of a computer chip. The central processing...Ch. 13 - Bayfield Mud Company case. The text Quantitative...
Knowledge Booster


Learn more about
Need a deep-dive on the concept behind this application? Look no further. Learn more about this topic, statistics and related others by exploring similar questions and additional content below.Similar questions
- Suppose you know that Bob's test score is above the mean, but he doesn't remember by how much. At least how many students must score lower than Bob?arrow_forwardIf a baby's weight is at the median, what's her percentile?arrow_forwardAt the same restaurant as in Question 19 with the same normal distribution, what's the chance of it taking no more than 15 minutes to get service?arrow_forward
- Clint, obviously not in college, sleeps an average of 8 hours per night with a standard deviation of 15 minutes. What's the chance of him sleeping between 7.5 and 8.5 hours on any given night? 0-(7-0) 200 91109s and doiw $20 (8-0) mol 8520 slang $199 galbrog seam side pide & D (newid se od poyesvig as PELEO PER AFTE editiw noudab temand van Czarrow_forwardTimes to complete a statistics exam have a normal distribution with a mean of 40 minutes and standard deviation of 6 minutes. Deshawn's time comes in at the 90th percentile. What percentage of the students are still working on their exams when Deshawn leaves?arrow_forwardSuppose that the weights of cereal boxes have a normal distribution with a mean of 20 ounces and standard deviation of half an ounce. A box that has a standard score of o weighs how much? syed by ilog ni 21arrow_forward
- Bob scores 80 on both his math exam (which has a mean of 70 and standard deviation of 10) and his English exam (which has a mean of 85 and standard deviation of 5). Find and interpret Bob's Z-scores on both exams to let him know which exam (if either) he did bet- ter on. Don't, however, let his parents know; let them think he's just as good at both subjects. algas 70) sering digarrow_forwardSue's math class exam has a mean of 70 with a standard deviation of 5. Her standard score is-2. What's her original exam score?arrow_forwardClint sleeps an average of 8 hours per night with a standard deviation of 15 minutes. What's the chance he will sleep less than 7.5 hours tonight? nut bow visarrow_forward
- Suppose that your score on an exam is directly at the mean. What's your standard score?arrow_forwardOne state's annual rainfall has a normal dis- tribution with a mean of 100 inches and standard deviation of 25 inches. Suppose that corn grows best when the annual rainfall is between 100 and 150 inches. What's the chance of achieving this amount of rainfall? wved now of sociarrow_forward13 Suppose that your exam score has a standard score of 0.90. Does this mean that 90 percent of the other exam scores are lower than yours?arrow_forward
arrow_back_ios
SEE MORE QUESTIONS
arrow_forward_ios
Recommended textbooks for you
 Glencoe Algebra 1, Student Edition, 9780079039897...AlgebraISBN:9780079039897Author:CarterPublisher:McGraw Hill
 Holt Mcdougal Larson Pre-algebra: Student Edition...AlgebraISBN:9780547587776Author:HOLT MCDOUGALPublisher:HOLT MCDOUGAL
 Big Ideas Math A Bridge To Success Algebra 1: Stu...AlgebraISBN:9781680331141Author:HOUGHTON MIFFLIN HARCOURTPublisher:Houghton Mifflin Harcourt
 College Algebra (MindTap Course List)AlgebraISBN:9781305652231Author:R. David Gustafson, Jeff HughesPublisher:Cengage Learning
Glencoe Algebra 1, Student Edition, 9780079039897...
Algebra
ISBN:9780079039897
Author:Carter
Publisher:McGraw Hill
Holt Mcdougal Larson Pre-algebra: Student Edition...
Algebra
ISBN:9780547587776
Author:HOLT MCDOUGAL
Publisher:HOLT MCDOUGAL
Big Ideas Math A Bridge To Success Algebra 1: Stu...
Algebra
ISBN:9781680331141
Author:HOUGHTON MIFFLIN HARCOURT
Publisher:Houghton Mifflin Harcourt
College Algebra (MindTap Course List)
Algebra
ISBN:9781305652231
Author:R. David Gustafson, Jeff Hughes
Publisher:Cengage Learning
Sampling Methods and Bias with Surveys: Crash Course Statistics #10; Author: CrashCourse;https://www.youtube.com/watch?v=Rf-fIpB4D50;License: Standard YouTube License, CC-BY
Statistics: Sampling Methods; Author: Mathispower4u;https://www.youtube.com/watch?v=s6ApdTvgvOs;License: Standard YouTube License, CC-BY