
Managerial Accounting: The Cornerstone of Business Decision-Making
7th Edition
ISBN: 9781337115773
Author: Maryanne M. Mowen, Don R. Hansen, Dan L. Heitger
Publisher: Cengage Learning
expand_more
expand_more
format_list_bulleted
Videos
Textbook Question
Chapter 13, Problem 42E
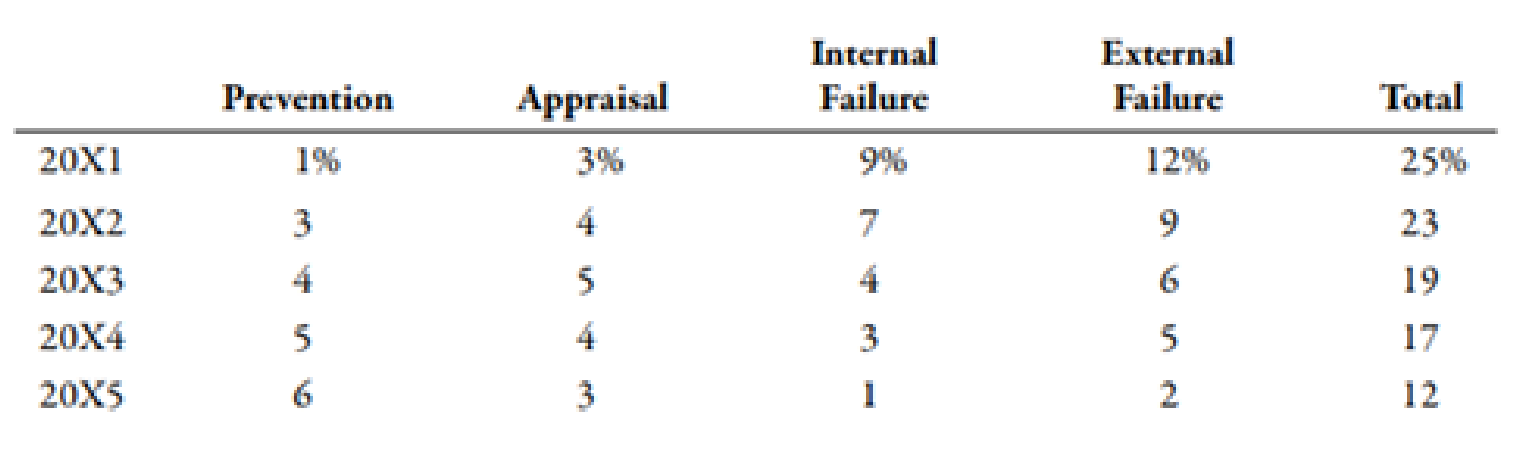
The controller of Emery, Inc. has computed quality costs as a percentage of sales for the past 5 years (20X1 was the first year the company implemented a quality improvement program). This information is as follows:
Required:
- 1. Prepare a trend graph for total quality costs. Comment on what the graph has to say about the success of the quality improvement program.
- 2. Prepare a graph that shows the trend for each quality cost category. What does the graph have to say about the success of the quality improvement program? Does this graph supply more insight than the total cost trend graph does?
- 3. Prepare a graph that compares the trend in relative control costs versus relative failure costs. Comment on the significance of this trend.
Expert Solution & Answer
Want to see the full answer?
Check out a sample textbook solution
Students have asked these similar questions
How Can I resolve this problem?
Walton Company has measured its quality costs for the past two years. After the company gathers its quality cost data, it summarizes those costs using the four categories shown below:
Required:
3. For this year, calculate the cost in each of the four categories as a percent of the total cost of quality.
4a. Calculate the change in total cost of quality over the two-year period.
Last Year
This Year
Prevention costs
$
339,200
$
637,000
Appraisal costs
$
467,300
$
496,000
Internal failure costs
$
853,200
$
545,000
External failure costs
$
1,001,000
$
734,400
Below is a list of various metrics used to measure performance. For each metric, identify the correct balanced scorecard perspective with which the metric is associated.
Metric
Balanced Scorecard Perspective
Average stock price
Economic value added
Employee turnover rates
Manufacturing cycle time
Market share
Number of days from product launch to shelf
Number of defects
Number of new patent applications
Percentage of repeat customers
Percentage decrease in operating costs
Percentage of sales generated by new products
Research and development spending as a percentage of net revenues
options:
Customer
Financial
Internal Business
Learning and Growth
USA Airlines uses the following performance measures. Classify the performance measures belowinto the most likely balanced scorecard perspective it relates to. Label your answers using C (customer),P (internal process), I (innovation and growth), or F (financial). Accidents or safety incidents per mile flown
Chapter 13 Solutions
Managerial Accounting: The Cornerstone of Business Decision-Making
Ch. 13 - Prob. 1DQCh. 13 - Prob. 2DQCh. 13 - Why should the incremental cost of a risk response...Ch. 13 - Prob. 4DQCh. 13 - Explain how performance measurement can help...Ch. 13 - Identify and discuss the four kinds of quality...Ch. 13 - Discuss the benefits of quality cost reports that...Ch. 13 - Prob. 8DQCh. 13 - Prob. 9DQCh. 13 - When will the average unit cost be used for value...
Ch. 13 - How do international issues affect the role of the...Ch. 13 - What it a foreign trade zone, and what advantages...Ch. 13 - Prob. 13DQCh. 13 - Prob. 14DQCh. 13 - Prob. 15DQCh. 13 - A fire insurance policy on a manufacturing plant...Ch. 13 - Prob. 2MCQCh. 13 - Prob. 3MCQCh. 13 - Which of the following risk response items would...Ch. 13 - Beginning with strategy, which of the following...Ch. 13 - In which areas of an organizations value chain can...Ch. 13 - Prob. 7MCQCh. 13 - Which of the following items (correctly describes...Ch. 13 - Which of the following is a prevention cost? a....Ch. 13 - Prob. 10MCQCh. 13 - Prob. 11MCQCh. 13 - Prob. 12MCQCh. 13 - Prob. 13MCQCh. 13 - A manufacturing cell within a value stream has...Ch. 13 - Prob. 15MCQCh. 13 - Prob. 16MCQCh. 13 - Prob. 17MCQCh. 13 - Prob. 18MCQCh. 13 - Prob. 19MCQCh. 13 - Prob. 20BEACh. 13 - Quality Cost Report Whitley Company had total...Ch. 13 - Andresen Company had the following quality costs...Ch. 13 - Norris Company implemented a quality improvement...Ch. 13 - Mabbut Company has the following departmental...Ch. 13 - During the week of May 10, Hyrum Manufacturing...Ch. 13 - Prob. 26BEACh. 13 - Prob. 27BEBCh. 13 - Quality Cost Report Loring Company had total sales...Ch. 13 - Cassara, Inc., had the following quality costs for...Ch. 13 - Pintura Company implemented a quality improvement...Ch. 13 - Gumbrecht Company has the following departmental...Ch. 13 - During the week of August 21, Parley Manufacturing...Ch. 13 - Prob. 33BEBCh. 13 - Prob. 34ECh. 13 - Prob. 35ECh. 13 - Crazy Fan Guard Company provides security services...Ch. 13 - Jacks Apps Company researches, develops, and sells...Ch. 13 - Prob. 38ECh. 13 - Prob. 39ECh. 13 - Classify the following quality costs as prevention...Ch. 13 - Bradshaw Company reported sales of 5,000,000 in...Ch. 13 - The controller of Emery, Inc. has computed quality...Ch. 13 - Erba Inc. has the following departmental layout...Ch. 13 - A value stream has three activities and two...Ch. 13 - A Box Scorecard was prepared for a value stream:...Ch. 13 - Match each term in Column A with its related...Ch. 13 - Match each term in Column A with its related...Ch. 13 - Prob. 48ECh. 13 - Refer to Exercise 13-48. Suppose that Kamber is...Ch. 13 - Prob. 50ECh. 13 - Prob. 51PCh. 13 - Prob. 52PCh. 13 - Dorsey Scott MU Company manufactures and bottles a...Ch. 13 - Danna Wise, president of Tidwell Company, recently...Ch. 13 - Prob. 55PCh. 13 - In 20X1, Don Blackburn, president of Price...Ch. 13 - Brasher Company is transitioning to a lean...Ch. 13 - Merkley Company, a manufacturer of machine parts,...Ch. 13 - Paladin Company manufactures plain paper fax...Ch. 13 - Custom Shutters. Inc., manufactures plantation...Ch. 13 - Prob. 61PCh. 13 - Corporate sustainability reports vary greatly...Ch. 13 - Luna Company is a printing company and a...Ch. 13 - Lindell Manufacturing embarked on an ambitious...Ch. 13 - Paterson Company, a U.S.-based company,...
Knowledge Booster


Learn more about
Need a deep-dive on the concept behind this application? Look no further. Learn more about this topic, accounting and related others by exploring similar questions and additional content below.Similar questions
- Ross Company implemented a quality improvement program and tracked the following for the five years: By cost category as a percentage of sales for the same period of time: Required: 1. Prepare a bar graph that reveals the trend in quality cost as a percentage of sales (time on the horizontal axis and percentages on the vertical). Comment on the message of the graph. 2. Prepare a bar graph for each cost category as a percentage of sales. What does this graph tell you? 3. What if management would like to have the trend in relative distribution of quality costs? Express this as a bar graph and comment on its significance.arrow_forwardPintura Company implemented a quality improvement program and tracked the following for the five years: By cost category as a percentage of sales for the same period of time: Required: 1. Prepare a bar graph that reveals the trend in quality cost as a percentage of sales (time on the horizontal axis and percentages on the vertical). Comment on the message of the graph. 2. Prepare a bar graph for each cost category as a percentage of sales. What does this graph tell you?arrow_forwardNorris Company implemented a quality improvement program and tracked the following for the 5 years: By cost category of sales for the same period of time: Required: 1. Prepare a bar graph (hat reveals the trend in quality cost as a percentage of sales (time on horizontal axis and percentages on the vertical). Comment on the message of the graph. 2. Prepare a bar graph for each cost category as a percentage of sales. What does this graph tell you?arrow_forward
- Silver Lining Inc. has a balanced scorecard with a strategy map that shows that delivery time and the number of erroneous shipments are expected to affect the companys ability to satisfy the customer. Further, the strategy map for the balanced scorecard shows that the hours from ordered to delivered affects the percentage of customers who shop again, and the number of erroneous shipments affects the online customer satisfaction rating. The following information is also available: The companys target hours from ordered to delivered is 40. Every hour over the ordered-to-delivered target results in a 0.5% decrease in the percentage of customers who shop again. The companys target number of erroneous shipments per year is no more than 65. Every error over the erroneous shipments target results in a 0.5 point decrease in the online customer satisfaction rating and an added future financial loss of 500. The company estimates that for every 1% decrease in the percentage of customers who shop again, future profit decreases by 4,000 and market share decreases by 0.3%. The company also estimates that for every 1 point decrease in the overall online customer satisfaction rating (on a scale of 1 to 10), future profit decreases by 3,000 and market share decreases by 0.6%. Using these estimates, determine how much future profit and future market share will change if: Average hours from ordered to shipped is 27.5. Average shipping time (hours from shipped to delivered) is 16.3. Number of erroneous shipments is 80.arrow_forwardThe president of a small manufacturing firm is concerned about the continual increase in manufacturing costs over the past several years. The following figures provide a time series of the cost per unit for the firms leading product over the past eight years: a. Construct a time series plot. What type of pattern exists in the data? b. Use simple linear regression analysis to find the parameters for the line that minimizes MSE for this time series. c. What is the average cost increase that the firm has been realizing per year? d. Compute an estimate of the cost/unit for next year.arrow_forwardGagnon Company reported the following sales and quality costs for the past four years. Assume that all quality costs are variable and that all changes in the quality cost ratios are due to a quality improvement program. Required: 1. Compute the quality costs for all four years. By how much did net income increase from Year 1 to Year 2 because of quality improvements? From Year 2 to Year 3? From Year 3 to Year 4? 2. The management of Gagnon Company believes it is possible to reduce quality costs to 2.5 percent of sales. Assuming sales will continue at the Year 4 level, calculate the additional profit potential facing Gagnon. Is the expectation of improving quality and reducing costs to 2.5 percent of sales realistic? Explain. 3. Assume that Gagnon produces one type of product, which is sold on a bid basis. In Years 1 and 2, the average bid was 400. In Year 1, total variable costs were 250 per unit. In Year 3, competition forced the bid to drop to 380. Compute the total contribution margin in Year 3 assuming the same quality costs as in Year 1. Now, compute the total contribution margin in Year 3 using the actual quality costs for Year 3. What is the increase in profitability resulting from the quality improvements made from Year 1 to Year 3?arrow_forward
- Rizzo Goal Inc. produces and sells hockey equipment, often custom made for online orders. The company has the following performance metrics on its balanced scorecard: days from ordered to delivered, number of shipping errors, customer retention rate, and market share. A measure map illustrates that the days from ordered to delivered and the number of shipping errors are both expected to directly affect the customer retention rate, which affects market share. Additional internal analysis finds that: Every shipping error over three shipping errors per month reduces the customer retention rate by 1.5%. On average, each day above three days from ordered to delivered yields a reduction in the customer retention rate of 1%. Each day before three days from order to delivery yields an increase in the customer retention rate of 1%, on average. Rizzo Goal Inc.s current customer retention rate is 60%. The company estimates that for every 1% increase or decrease in the customer retention rate, market share changes 0.5% in the same direction. Rizzo Goal Inc.s current market share is 21.4%. Ignoring any other factors, if the company has six shipping errors this month and an average of 3.5 days from ordered to delivered, determine (a) the new customer retention rate and (b) the new market share that Rizzo Goal Inc. expects to have.arrow_forwardThe following series of statements or phrases are associated with product life-cycle viewpoints. Identify whether each one is associated with the marketing, production, or customer viewpoint. Where possible, identify the particular characteristic being described. If the statement or phrase fits more than one viewpoint, label it as interactive. Explain the interaction. a. Sales are increasing at an increasing rate. b. The cost of maintaining the product after it is purchased. c. The product is losing market acceptance and sales are beginning to decrease. d. A design is chosen to minimize post-purchase costs. e. Ninety percent or more of the costs are committed during the development stage. f. The length of time that the product serves the needs of a customer. g. All the costs associated with a product for its entire life cycle. h. The time in which a product generates revenue for a company. i. Profits tend to reach peak levels during this stage. j. Customers have the lowest price sensitivity during this stage. k. Describes the general sales pattern of a product as it passes through distinct life-cycle stages. l. The concern is with product performance and price. m. Actions taken so that life-cycle profits are maximized. n. Emphasizes internal activities that are needed to develop, produce, market, and service products.arrow_forwardIn 20X1, Don Blackburn, president of Price Electronics, received a report indicating that quality costs were 31% of sales. Faced with increasing pressures from imported goods. Don resolved to take measures to improve the overall quality of the companys products. After hiring a consultant in 20X1, the company began an aggressive program of total quality control. At the end of 20X5, Don requested an analysis of the progress the company had made in reducing and controlling quality costs. The accounting department assembled the following data: Required: 1. Compute the quality costs as a percentage of sales by category and in total for each year. 2. Prepare a multiple-year trend graph for quality costs, both by total costs and by category. Using the graph, assess the progress made in reducing and controlling quality costs. Does the graph provide evidence that quality has improved? Explain. 3. Using the 20X1 quality cost relationships (assume all costs are variable), calculate the quality costs that would have prevailed in 20X4. By how much did profits increase in 20X4 because of the quality improvement program? Repeat for 20X5.arrow_forward
- Consider the following list of scorecard measures: a. Product profitability b. Ratings from customer surveys c. Number of patents pending d. Strategic job coverage ratio e. Revenue per employee f. Quality costs g. Percentage of market h. Employee turnover percentages i. First-pass yields j. On-time delivery percentage k. Percentage of revenues from new sources l. Economic value added Required: Classify each measure according to the following: perspective, financial or nonfinancial, subjective or objective, and external or internal. When the perspective is process, identify which type of process: innovation, operations, or post-sales service.arrow_forwardFrom the following list of performance measures, label each one as Financial, Customer, Internal Business Processes, or Learning and Growth: Percentage of on-time deliveries Employee turnover ratio Revenue from new products Number of new customers Percentage of compensation based on team performance Percentage of products returned Operating income Time taken to replace defective productsarrow_forwardClassify the performance measures below into the most likely balanced scorecard perspective itrelates to. Label your answers using C (customer), P (internal process), I (innovation and growth), or F(financial). Length of time raw materials are in inventoryarrow_forward
arrow_back_ios
SEE MORE QUESTIONS
arrow_forward_ios
Recommended textbooks for you
 Managerial Accounting: The Cornerstone of Busines...AccountingISBN:9781337115773Author:Maryanne M. Mowen, Don R. Hansen, Dan L. HeitgerPublisher:Cengage Learning
 Cornerstones of Cost Management (Cornerstones Ser...AccountingISBN:9781305970663Author:Don R. Hansen, Maryanne M. MowenPublisher:Cengage Learning
 Managerial AccountingAccountingISBN:9781337912020Author:Carl Warren, Ph.d. Cma William B. TaylerPublisher:South-Western College Pub
 Financial And Managerial AccountingAccountingISBN:9781337902663Author:WARREN, Carl S.Publisher:Cengage Learning,
 Excel Applications for Accounting PrinciplesAccountingISBN:9781111581565Author:Gaylord N. SmithPublisher:Cengage Learning
 Principles of Cost AccountingAccountingISBN:9781305087408Author:Edward J. Vanderbeck, Maria R. MitchellPublisher:Cengage Learning
Managerial Accounting: The Cornerstone of Busines...
Accounting
ISBN:9781337115773
Author:Maryanne M. Mowen, Don R. Hansen, Dan L. Heitger
Publisher:Cengage Learning
Cornerstones of Cost Management (Cornerstones Ser...
Accounting
ISBN:9781305970663
Author:Don R. Hansen, Maryanne M. Mowen
Publisher:Cengage Learning
Managerial Accounting
Accounting
ISBN:9781337912020
Author:Carl Warren, Ph.d. Cma William B. Tayler
Publisher:South-Western College Pub
Financial And Managerial Accounting
Accounting
ISBN:9781337902663
Author:WARREN, Carl S.
Publisher:Cengage Learning,
Excel Applications for Accounting Principles
Accounting
ISBN:9781111581565
Author:Gaylord N. Smith
Publisher:Cengage Learning
Principles of Cost Accounting
Accounting
ISBN:9781305087408
Author:Edward J. Vanderbeck, Maria R. Mitchell
Publisher:Cengage Learning
Inspection and Quality control in Manufacturing. What is quality inspection?; Author: Educationleaves;https://www.youtube.com/watch?v=Ey4MqC7Kp7g;License: Standard youtube license