![Managerial Accounting: The Cornerstone of Business Decision-Making](https://www.bartleby.com/isbn_cover_images/9781337115773/9781337115773_largeCoverImage.gif)
Managerial Accounting: The Cornerstone of Business Decision-Making
7th Edition
ISBN: 9781337115773
Author: Maryanne M. Mowen, Don R. Hansen, Dan L. Heitger
Publisher: Cengage Learning
expand_more
expand_more
format_list_bulleted
Textbook Question
thumb_up100%
Chapter 13, Problem 56P
In 20X1, Don Blackburn, president of Price Electronics, received a report indicating that quality costs were 31% of sales. Faced with increasing pressures from imported goods. Don resolved to take measures to improve the overall quality of the company’s products. After hiring a consultant in 20X1, the company began an aggressive program of total quality control. At the end of 20X5, Don requested an analysis of the progress the company had made in reducing and controlling quality costs. The accounting department assembled the following data:
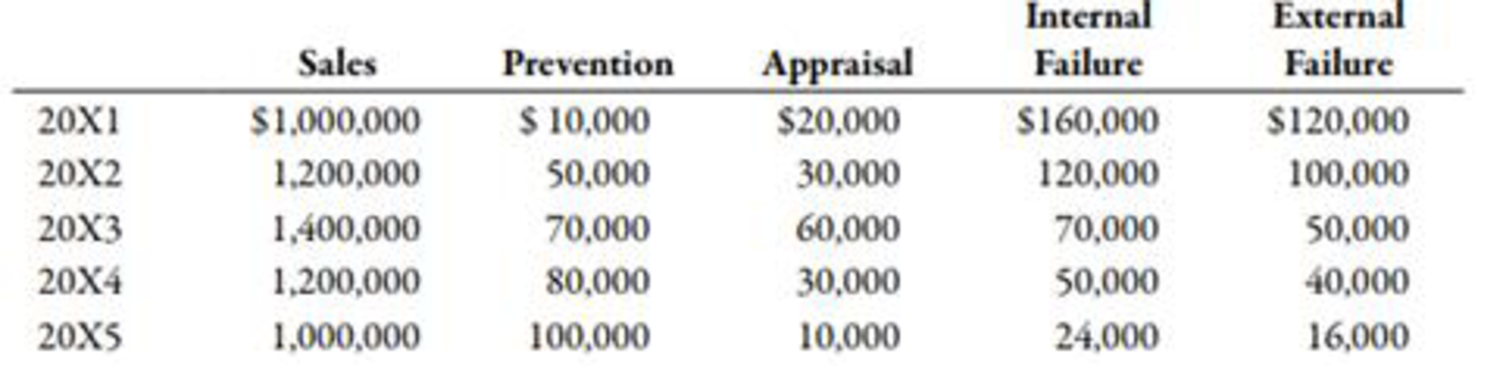
Required:
- 1. Compute the quality costs as a percentage of sales by category and in total for each year.
- 2. Prepare a multiple-year trend graph for quality costs, both by total costs and by category. Using the graph, assess the progress made in reducing and controlling quality costs. Does the graph provide evidence that quality has improved? Explain.
- 3. Using the 20X1 quality cost relationships (assume all costs are variable), calculate the quality costs that would have prevailed in 20X4. By how much did profits increase in 20X4 because of the quality improvement program? Repeat for 20X5.
Expert Solution & Answer
![Check Mark](/static/check-mark.png)
Trending nowThis is a popular solution!
![Blurred answer](/static/blurred-answer.jpg)
Students have asked these similar questions
Danna Lummus, the president of Karlene Company, has recently returned from a conference on quality and productivity. At the conference, she learned that many American firms have made significant progress in improving quality and reducing quality costs. Many of these firms have been able to reduce quality costs from 20 to 30 percent of sales to 2 to 3 percent of sales. She was skeptical, however, about this statistic. Even if the quality gurus were right, she was sure that her company’s quality costs were much lower—probably less than 5 percent. On the other hand, if she was wrong, she would be passing up an opportunity to improve profits significantly and simultaneously strengthen her competitive position. In fact, she reflected on the com- ment of one of the quality experts: “Quality has become a condition of entrance to the market. If the product is not good, you will quickly go out of business.” The qual- ity issue was at least worth exploring. Moreover, she decided that it may be…
Dana Wise, president of Tidwell Company, recently returned from a conference on quality and productivity. At the conference, he was told that many firms have quality costs totaling 20 to 30% of sales. The quality experts at the conference convinced him that a company could increase its profitability by improving quality. However, he was of the opinion that the quality of Tidwell Company was much less than 20% - probably more in the 4 to 6% range. However, because the potential for increasing profits was so great if he was wrong, he decided to request a preliminry estimate of the total quality costs currently being incurred. He asked his controller for a summary of quality costs, with the costs classified into four categories: prevention, appraisal, internal failure, or external failure. He also wanted the costs expressed as a percentage of both sales and profits. The controller had his staff assemble the following information from the past year, 20x1:
a. Sales revenue,…
Wayne Johnson, president of Banshee Company, recently returned from a conference on quality and productivity. At the conference, he was told that many American firms have quality coststotaling 20 to 30 percent of sales. He, however, was skeptical about this statistic. But even if the quality gurus were right, he was sure that his company’s quality costs were much lower—probably less than 5 percent. On the other hand, if he was wrong, he would be passing up an opportunity to improve profits significantly and simultaneously strengthen his competitive position. The possibility was at least worth exploring. He knew that his company produced most of the information needed for quality cost reporting—but there never was a need to bother with any formal quality data gathering and analysis. This conference, however, had convinced him that a firm’s profitability can increase significantly by improving quality—provided the potential for improvement exists. Thus, before committing the company to a…
Chapter 13 Solutions
Managerial Accounting: The Cornerstone of Business Decision-Making
Ch. 13 - Prob. 1DQCh. 13 - Prob. 2DQCh. 13 - Why should the incremental cost of a risk response...Ch. 13 - Prob. 4DQCh. 13 - Explain how performance measurement can help...Ch. 13 - Identify and discuss the four kinds of quality...Ch. 13 - Discuss the benefits of quality cost reports that...Ch. 13 - Prob. 8DQCh. 13 - Prob. 9DQCh. 13 - When will the average unit cost be used for value...
Ch. 13 - How do international issues affect the role of the...Ch. 13 - What it a foreign trade zone, and what advantages...Ch. 13 - Prob. 13DQCh. 13 - Prob. 14DQCh. 13 - Prob. 15DQCh. 13 - A fire insurance policy on a manufacturing plant...Ch. 13 - Prob. 2MCQCh. 13 - Prob. 3MCQCh. 13 - Which of the following risk response items would...Ch. 13 - Beginning with strategy, which of the following...Ch. 13 - In which areas of an organizations value chain can...Ch. 13 - Prob. 7MCQCh. 13 - Which of the following items (correctly describes...Ch. 13 - Which of the following is a prevention cost? a....Ch. 13 - Prob. 10MCQCh. 13 - Prob. 11MCQCh. 13 - Prob. 12MCQCh. 13 - Prob. 13MCQCh. 13 - A manufacturing cell within a value stream has...Ch. 13 - Prob. 15MCQCh. 13 - Prob. 16MCQCh. 13 - Prob. 17MCQCh. 13 - Prob. 18MCQCh. 13 - Prob. 19MCQCh. 13 - Prob. 20BEACh. 13 - Quality Cost Report Whitley Company had total...Ch. 13 - Andresen Company had the following quality costs...Ch. 13 - Norris Company implemented a quality improvement...Ch. 13 - Mabbut Company has the following departmental...Ch. 13 - During the week of May 10, Hyrum Manufacturing...Ch. 13 - Prob. 26BEACh. 13 - Prob. 27BEBCh. 13 - Quality Cost Report Loring Company had total sales...Ch. 13 - Cassara, Inc., had the following quality costs for...Ch. 13 - Pintura Company implemented a quality improvement...Ch. 13 - Gumbrecht Company has the following departmental...Ch. 13 - During the week of August 21, Parley Manufacturing...Ch. 13 - Prob. 33BEBCh. 13 - Prob. 34ECh. 13 - Prob. 35ECh. 13 - Crazy Fan Guard Company provides security services...Ch. 13 - Jacks Apps Company researches, develops, and sells...Ch. 13 - Prob. 38ECh. 13 - Prob. 39ECh. 13 - Classify the following quality costs as prevention...Ch. 13 - Bradshaw Company reported sales of 5,000,000 in...Ch. 13 - The controller of Emery, Inc. has computed quality...Ch. 13 - Erba Inc. has the following departmental layout...Ch. 13 - A value stream has three activities and two...Ch. 13 - A Box Scorecard was prepared for a value stream:...Ch. 13 - Match each term in Column A with its related...Ch. 13 - Match each term in Column A with its related...Ch. 13 - Prob. 48ECh. 13 - Refer to Exercise 13-48. Suppose that Kamber is...Ch. 13 - Prob. 50ECh. 13 - Prob. 51PCh. 13 - Prob. 52PCh. 13 - Dorsey Scott MU Company manufactures and bottles a...Ch. 13 - Danna Wise, president of Tidwell Company, recently...Ch. 13 - Prob. 55PCh. 13 - In 20X1, Don Blackburn, president of Price...Ch. 13 - Brasher Company is transitioning to a lean...Ch. 13 - Merkley Company, a manufacturer of machine parts,...Ch. 13 - Paladin Company manufactures plain paper fax...Ch. 13 - Custom Shutters. Inc., manufactures plantation...Ch. 13 - Prob. 61PCh. 13 - Corporate sustainability reports vary greatly...Ch. 13 - Luna Company is a printing company and a...Ch. 13 - Lindell Manufacturing embarked on an ambitious...Ch. 13 - Paterson Company, a U.S.-based company,...
Knowledge Booster
Learn more about
Need a deep-dive on the concept behind this application? Look no further. Learn more about this topic, accounting and related others by exploring similar questions and additional content below.Similar questions
- In 2011, Milton Thayne, president of Carbondale Electronics, received a report indicating that quality costs were 31 percent of sales. Faced with increasing pressures from imported goods, Milton resolved to take measures to improve the overall quality of the companys products. After hiring a consultant in 20x0, the company began an aggressive program of total quality control. At the end of 20x5, Milton requested an analysis of the progress the company had made in reducing and controlling quality costs. The Accounting Department assembled the following data: Required: 1. Compute the quality costs as a percentage of sales by category and in total for each year. 2. Prepare a multiple-year trend graph for quality costs, both by total costs and by category. Using the graph, assess the progress made in reducing and controlling quality costs. Does the graph provide evidence that quality has improved? Explain. 3. Using the 20x1 quality cost relationships (assume all costs are variable), calculate the quality costs that would have prevailed in 20x4. By how much did profits increase in 20x4 because of the quality improvement program? Repeat for 20x5.arrow_forwardIn 20x5, Major Company initiated a full-scale, quality improvement program. At the end of the year, Jack Aldredge, the president, noted with some satisfaction that the defects per unit of product had dropped significantly compared to the prior year. He was also pleased that relationships with suppliers had improved and defective materials had declined. The new quality training program was also well accepted by employees. Of most interest to the president, however, was the impact of the quality improvements on profitability. To help assess the dollar impact of the quality improvements, the actual sales and the actual quality costs for 20x4 and 20x5 are as follows by quality category: All prevention costs are fixed (by discretion). Assume all other quality costs are unit-level variable. Required: 1. Compute the relative distribution of quality costs for each year and prepare a pie chart. Do you believe that the company is moving in the right direction in terms of the balance among the quality cost categories? Explain. 2. Prepare a one-year trend performance report for 20x5 (compare the actual costs of 20x5 with those of 20x4, adjusted for differences in sales volume). How much have profits increased because of the quality improvements made by Major Company? 3. Estimate the additional improvement in profits if Major Company ultimately reduces its quality costs to 2.5 percent of sales revenues (assume sales of 10 million).arrow_forwardKathy Shorts, president of Oliver Company, was concerned with the trend in sales and profitability. The company had been losing customers at an alarming rate. Furthermore, the company was barely breaking even. Investigation revealed that poor quality was at the root of the problem. At the end of 20x5, Kathy decided to begin a quality improvement program. As a first step, she identified the following costs in the accounting records as quality related: Required: 1. Prepare a quality cost report by quality cost category. 2. Calculate the relative distribution percentages for each quality cost category. Comment on the distribution. 3. Using the Taguchi loss function, an average loss per unit is computed to be 15 per unit. What are the hidden costs of external failure? How does this affect the relative distribution? 4. Shortss quality manager decided not to bother with the hidden costs. What do you think was his reasoning? Any efforts to reduce measured external failure costs will also reduce the hidden costs. Do you agree or disagree? Explain.arrow_forward
- Gagnon Company reported the following sales and quality costs for the past four years. Assume that all quality costs are variable and that all changes in the quality cost ratios are due to a quality improvement program. Required: 1. Compute the quality costs for all four years. By how much did net income increase from Year 1 to Year 2 because of quality improvements? From Year 2 to Year 3? From Year 3 to Year 4? 2. The management of Gagnon Company believes it is possible to reduce quality costs to 2.5 percent of sales. Assuming sales will continue at the Year 4 level, calculate the additional profit potential facing Gagnon. Is the expectation of improving quality and reducing costs to 2.5 percent of sales realistic? Explain. 3. Assume that Gagnon produces one type of product, which is sold on a bid basis. In Years 1 and 2, the average bid was 400. In Year 1, total variable costs were 250 per unit. In Year 3, competition forced the bid to drop to 380. Compute the total contribution margin in Year 3 assuming the same quality costs as in Year 1. Now, compute the total contribution margin in Year 3 using the actual quality costs for Year 3. What is the increase in profitability resulting from the quality improvements made from Year 1 to Year 3?arrow_forwardAt the end of 20x1, Mejorar Company implemented a low-cost strategy to improve its competitive position. Its objective was to become the low-cost producer in its industry. A Balanced Scorecard was developed to guide the company toward this objective. To lower costs, Mejorar undertook a number of improvement activities such as JIT production, total quality management, and activity-based management. Now, after two years of operation, the president of Mejorar wants some assessment of the achievements. To help provide this assessment, the following information on one product has been gathered: Required: 1. Compute the following measures for 20x1 and 20x3: a. Actual velocity and cycle time b. Percentage of total revenue from new customers (assume one unit per customer) c. Percentage of very satisfied customers (assume each customer purchases one unit) d. Market share e. Percentage change in actual product cost (for 20x3 only) f. Percentage change in days of inventory (for 20x3 only) g. Defective units as a percentage of total units produced h. Total hours of training i. Suggestions per production worker j. Total revenue k. Number of new customers 2. For the measures listed in Requirement 1, list likely strategic objectives, classified according to the four Balance Scorecard perspectives. Assume there is one measure per objective.arrow_forwardNabors Company had actual quality costs for the year ended June 30, 20x5, as given below. At the zero-defect state, Nabors expects to spend 375,000 on quality engineering, 75,000 on vendor certification, and 50,000 on packaging inspection. Assume sales to be 25,000,000. Required: 1. Prepare a long-range performance report for 20x5. What does this report tell the management of Nabors? 2. Explain why quality costs still are present for the zero-defect state. 3. What if Nabors achieves the zero-defect state reflected in the report? What are some of the implications of this achievement?arrow_forward
- Muning Corporation has a used a traditional accounting system to apply quality control costs uniformly to all products at a rate of P20 per direct labor hour. The average monthly direct labor hours for its main products are 9,600 hours. Muning wants to shift to ABC system in order to allocate quality control costs to its product in a more equitable manner. To start with, the process value analysis was conducted. Quality control activities were determined, as well as the appropriate cost drivers and cost driver rates. The analysis yielded the following: Activity Cost Driver Rate Quantity for Main Product Inspection of materials deliveries Inspections of goods in process Classes of materials P500 per class 10 per unit 20 classes Number of units 12,000 units Final inspection before delivery of finished goods Number of orders 200 per order 100 orders The quality control cost that would be assigned to the main products using traditional costing system a. 120,000 b. 150,000 c. 192,000 d.…arrow_forwardT Formeloza Corp. has used a traditional cost accounting system to apply quality control costs uniformly to all products at a rate of P20 per direct labor hour. The average monthly direct labor hours for its main product are 28,800 hours. T Formeloza Corp. wants to shift to ABC system in order to allocate quality control costs to its products in a more equitable manner. To start with, process value analysis was conducted. Quality control activities were determined, as well as the appropriate cost drivers and cost driver rates. The analysis yielded the following: Quantity for Main Product 40 classes Activity Cost Driver Rate Inspection of materials deliveries Inspection of goods in process Final inspection before delivery of finished goods Classes of materials P500 per class Number of units 10 per unit 24,000 units Number of orders 200 per order 200 orders The quality control cost that would be assigned to the main product using the traditional costing system is а. Р576,000 ь. Р720,000…arrow_forwardHow Can I resolve this problem? Walton Company has measured its quality costs for the past two years. After the company gathers its quality cost data, it summarizes those costs using the four categories shown below: Required: 3. For this year, calculate the cost in each of the four categories as a percent of the total cost of quality. 4a. Calculate the change in total cost of quality over the two-year period. Last Year This Year Prevention costs $ 339,200 $ 637,000 Appraisal costs $ 467,300 $ 496,000 Internal failure costs $ 853,200 $ 545,000 External failure costs $ 1,001,000 $ 734,400arrow_forward
- A company currently using an inspection process in its material receiving department is trying to install an overall cost reduction program. One possible reduction is the elimination of one inspection position. This position tests material that has defective content on an average of 0.04. By inspecting all items, the inspector is able to remove all defects. The inspector can inspect 50 units per hour. The hourly rate including fringe benefits for this position is $9. If the inspection position is eliminated, defects will go into the product assembly and will have to be replaced later at a cost of $10 each when they are detected in final product testing. (Answer in Appendix D)a. Should this inspection position be eliminated?b. What is the cost to inspect each unit?c. Is there a benefit (or loss) from the current inspection process? How much?arrow_forwardWalton Company has measured its quality costs for the past two years. After the company gathers its quality cost data, it summarizes those costs using the four categories shown below: Prevention costs Appraisal costs Internal failure costs Last Year $ 378,400 $ 440,600 This Year $ 591,500 $ 550,500 $ 813,700 $ 455,000 $ 1,144,000 $ 652,800 External failure costs Required: 1. Calculate the total cost of quality last year and this year. 2. For last year, calculate the cost in each of the four categories as a percent of the total cost of quality. 3. For this year, calculate the cost in each of the four categories as a percent of the total cost of quality. 4-a. Calculate the change in total cost of quality over the two-year period. 4-b. Is performance trending in a favorable or unfavorable direction? Complete this question by entering your answers in the tabs below. Required 1 Required 2 Required 3 Required 4A Required 4B Calculate the total cost of quality last year and this year. Total…arrow_forwardWalton Company has measured its quality costs for the past two years. After the company gathers its quality cost data, it summarizes those costs using the four categories shown below: Prevention costs Appraisal costs Internal failure costs External failure costs Last Year $ 353,400 $ 445,000 $ 766,300 $ 1,034,000 Required: 1. Calculate the total cost of quality last year and this year. 2. For last year, calculate the cost in each of the four categories as a percent of the total cost of quality. 3. For this year, calculate the cost in each of the four categories as a percent of the total cost of quality. 4-a. Calculate the change in total cost of quality over the two-year period. 4-b. Is performance trending in a favorable or unfavorable direction? Required 1 Required 2 This Year $ 611,000 $ 528,700 $ 550,000 $ 714,000 Complete this question by entering your answers in the tabs below. Favorable OUnfavorable Required 3 Required 4A Required 4B Is performance trending in a favorable or…arrow_forward
arrow_back_ios
SEE MORE QUESTIONS
arrow_forward_ios
Recommended textbooks for you
- Managerial Accounting: The Cornerstone of Busines...AccountingISBN:9781337115773Author:Maryanne M. Mowen, Don R. Hansen, Dan L. HeitgerPublisher:Cengage LearningCornerstones of Cost Management (Cornerstones Ser...AccountingISBN:9781305970663Author:Don R. Hansen, Maryanne M. MowenPublisher:Cengage LearningManagerial AccountingAccountingISBN:9781337912020Author:Carl Warren, Ph.d. Cma William B. TaylerPublisher:South-Western College Pub
- Auditing: A Risk Based-Approach (MindTap Course L...AccountingISBN:9781337619455Author:Karla M Johnstone, Audrey A. Gramling, Larry E. RittenbergPublisher:Cengage Learning
![Text book image](https://www.bartleby.com/isbn_cover_images/9781337115773/9781337115773_smallCoverImage.gif)
Managerial Accounting: The Cornerstone of Busines...
Accounting
ISBN:9781337115773
Author:Maryanne M. Mowen, Don R. Hansen, Dan L. Heitger
Publisher:Cengage Learning
![Text book image](https://www.bartleby.com/isbn_cover_images/9781305970663/9781305970663_smallCoverImage.gif)
Cornerstones of Cost Management (Cornerstones Ser...
Accounting
ISBN:9781305970663
Author:Don R. Hansen, Maryanne M. Mowen
Publisher:Cengage Learning
![Text book image](https://www.bartleby.com/isbn_cover_images/9781337912020/9781337912020_smallCoverImage.jpg)
Managerial Accounting
Accounting
ISBN:9781337912020
Author:Carl Warren, Ph.d. Cma William B. Tayler
Publisher:South-Western College Pub
![Text book image](https://www.bartleby.com/isbn_cover_images/9781337619455/9781337619455_smallCoverImage.gif)
Auditing: A Risk Based-Approach (MindTap Course L...
Accounting
ISBN:9781337619455
Author:Karla M Johnstone, Audrey A. Gramling, Larry E. Rittenberg
Publisher:Cengage Learning
Inspection and Quality control in Manufacturing. What is quality inspection?; Author: Educationleaves;https://www.youtube.com/watch?v=Ey4MqC7Kp7g;License: Standard youtube license