
Managerial Accounting: The Cornerstone of Business Decision-Making
7th Edition
ISBN: 9781337115773
Author: Maryanne M. Mowen, Don R. Hansen, Dan L. Heitger
Publisher: Cengage Learning
expand_more
expand_more
format_list_bulleted
Videos
Textbook Question
Chapter 13, Problem 23BEA
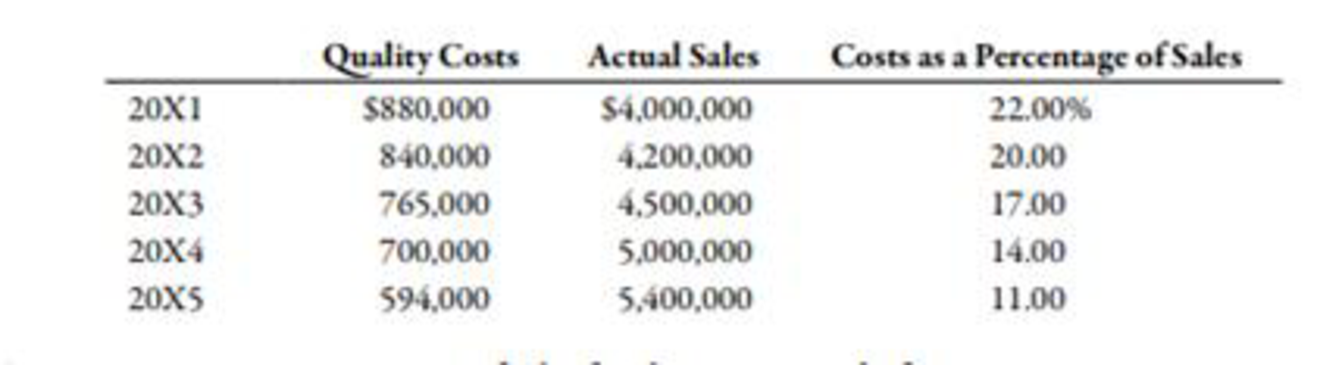
Norris Company implemented a quality improvement program and tracked the following for the 5 years:
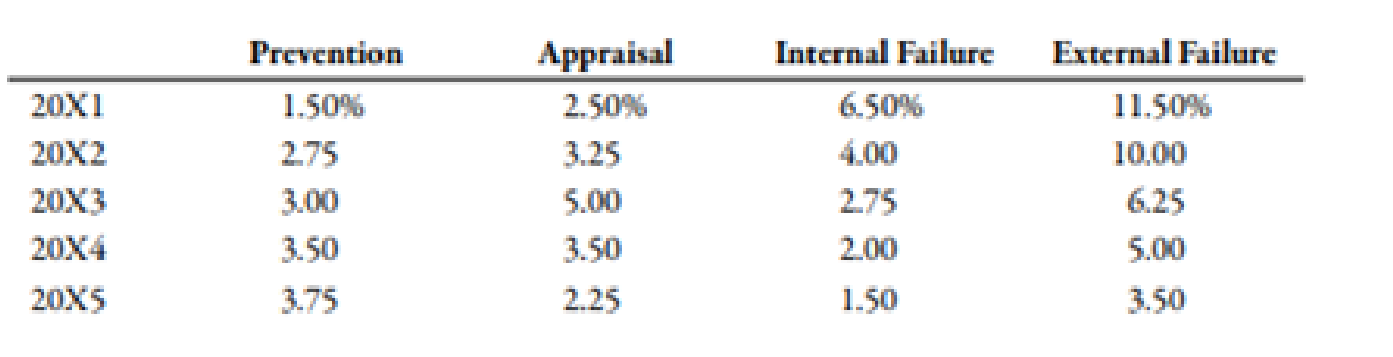
By cost category of sales for the same period of time:
Required:
- 1. Prepare a bar graph (hat reveals the trend in quality cost as a percentage of sales (time on horizontal axis and percentages on the vertical). Comment on the message of the graph.
- 2. Prepare a bar graph for each cost category as a percentage of sales. What does this graph tell you?
Expert Solution & Answer
Want to see the full answer?
Check out a sample textbook solution
Students have asked these similar questions
The completed Payroll Register for the February and March biweekly pay periods is provided, assuming benefits went into effect as anticipated.
Required:
Using the payroll registers, complete the General Journal entries as follows:
February 10 Journalize the employee pay.
February 10 Journalize the employer payroll tax for the February 10 pay period. Use 5.4 percent SUTA and 0.6 percent FUTA. No employees will exceed the FUTA or SUTA wage base.
February 14 Issue the employee pay.
February 24 Journalize the employee pay.
February 24 Journalize the employer payroll tax for the February 24 pay period. Use 5.4 percent SUTA and 0.6 percent FUTA. No employee will exceed the FUTA or SUTA wage base.
February 28 Issue the employee pay.
February 28 Issue payment for the payroll liabilities.
March 10 Journalize the employee pay.
March 10 Journalize the employer payroll tax for the March 10 pay period. Use 5.4 percent SUTA and 0.6 percent FUTA. No employees will exceed the FUTA or SUTA wage base.…
Please given step by step explanation general accounting question
Don't use ai solution please given answer general accounting
Chapter 13 Solutions
Managerial Accounting: The Cornerstone of Business Decision-Making
Ch. 13 - Prob. 1DQCh. 13 - Prob. 2DQCh. 13 - Why should the incremental cost of a risk response...Ch. 13 - Prob. 4DQCh. 13 - Explain how performance measurement can help...Ch. 13 - Identify and discuss the four kinds of quality...Ch. 13 - Discuss the benefits of quality cost reports that...Ch. 13 - Prob. 8DQCh. 13 - Prob. 9DQCh. 13 - When will the average unit cost be used for value...
Ch. 13 - How do international issues affect the role of the...Ch. 13 - What it a foreign trade zone, and what advantages...Ch. 13 - Prob. 13DQCh. 13 - Prob. 14DQCh. 13 - Prob. 15DQCh. 13 - A fire insurance policy on a manufacturing plant...Ch. 13 - Prob. 2MCQCh. 13 - Prob. 3MCQCh. 13 - Which of the following risk response items would...Ch. 13 - Beginning with strategy, which of the following...Ch. 13 - In which areas of an organizations value chain can...Ch. 13 - Prob. 7MCQCh. 13 - Which of the following items (correctly describes...Ch. 13 - Which of the following is a prevention cost? a....Ch. 13 - Prob. 10MCQCh. 13 - Prob. 11MCQCh. 13 - Prob. 12MCQCh. 13 - Prob. 13MCQCh. 13 - A manufacturing cell within a value stream has...Ch. 13 - Prob. 15MCQCh. 13 - Prob. 16MCQCh. 13 - Prob. 17MCQCh. 13 - Prob. 18MCQCh. 13 - Prob. 19MCQCh. 13 - Prob. 20BEACh. 13 - Quality Cost Report Whitley Company had total...Ch. 13 - Andresen Company had the following quality costs...Ch. 13 - Norris Company implemented a quality improvement...Ch. 13 - Mabbut Company has the following departmental...Ch. 13 - During the week of May 10, Hyrum Manufacturing...Ch. 13 - Prob. 26BEACh. 13 - Prob. 27BEBCh. 13 - Quality Cost Report Loring Company had total sales...Ch. 13 - Cassara, Inc., had the following quality costs for...Ch. 13 - Pintura Company implemented a quality improvement...Ch. 13 - Gumbrecht Company has the following departmental...Ch. 13 - During the week of August 21, Parley Manufacturing...Ch. 13 - Prob. 33BEBCh. 13 - Prob. 34ECh. 13 - Prob. 35ECh. 13 - Crazy Fan Guard Company provides security services...Ch. 13 - Jacks Apps Company researches, develops, and sells...Ch. 13 - Prob. 38ECh. 13 - Prob. 39ECh. 13 - Classify the following quality costs as prevention...Ch. 13 - Bradshaw Company reported sales of 5,000,000 in...Ch. 13 - The controller of Emery, Inc. has computed quality...Ch. 13 - Erba Inc. has the following departmental layout...Ch. 13 - A value stream has three activities and two...Ch. 13 - A Box Scorecard was prepared for a value stream:...Ch. 13 - Match each term in Column A with its related...Ch. 13 - Match each term in Column A with its related...Ch. 13 - Prob. 48ECh. 13 - Refer to Exercise 13-48. Suppose that Kamber is...Ch. 13 - Prob. 50ECh. 13 - Prob. 51PCh. 13 - Prob. 52PCh. 13 - Dorsey Scott MU Company manufactures and bottles a...Ch. 13 - Danna Wise, president of Tidwell Company, recently...Ch. 13 - Prob. 55PCh. 13 - In 20X1, Don Blackburn, president of Price...Ch. 13 - Brasher Company is transitioning to a lean...Ch. 13 - Merkley Company, a manufacturer of machine parts,...Ch. 13 - Paladin Company manufactures plain paper fax...Ch. 13 - Custom Shutters. Inc., manufactures plantation...Ch. 13 - Prob. 61PCh. 13 - Corporate sustainability reports vary greatly...Ch. 13 - Luna Company is a printing company and a...Ch. 13 - Lindell Manufacturing embarked on an ambitious...Ch. 13 - Paterson Company, a U.S.-based company,...
Knowledge Booster


Learn more about
Need a deep-dive on the concept behind this application? Look no further. Learn more about this topic, accounting and related others by exploring similar questions and additional content below.Similar questions
- Answer? ? Financial accounting questionarrow_forwardNeither Joe nor Jessie is blind or over age 65, and they plan to file as married joint. Assume that the employer portion of the self-employment tax on Jessie's income is $831. Joe and Jessie have summarized the income and expenses they expect to report this year as follows: Income: Joe's salary $ 144,100 Jessie's craft sales 18,400 Interest from certificate of deposit 1,650 Interest from Treasury bond funds 716 Interest from municipal bond funds 920 Expenditures: Federal income tax withheld from Joe's wages $ 13,700 State income tax withheld from Joe's wages 6,400 Social Security tax withheld from Joe's wages 7,482 Real estate taxes on residence 6,200 Automobile licenses (based on weight) 310 State sales tax paid 1,150 Home mortgage interest 26,000 Interest on Masterdebt credit card 2,300 Medical expenses (unreimbursed) 1,690 Joe's employee expenses (unreimbursed) 2,400 Cost of…arrow_forwardNeed General Accounting Question solutionarrow_forward
arrow_back_ios
SEE MORE QUESTIONS
arrow_forward_ios
Recommended textbooks for you
 Managerial Accounting: The Cornerstone of Busines...AccountingISBN:9781337115773Author:Maryanne M. Mowen, Don R. Hansen, Dan L. HeitgerPublisher:Cengage Learning
 Cornerstones of Cost Management (Cornerstones Ser...AccountingISBN:9781305970663Author:Don R. Hansen, Maryanne M. MowenPublisher:Cengage Learning
 Excel Applications for Accounting PrinciplesAccountingISBN:9781111581565Author:Gaylord N. SmithPublisher:Cengage Learning
 Essentials of Business Analytics (MindTap Course ...StatisticsISBN:9781305627734Author:Jeffrey D. Camm, James J. Cochran, Michael J. Fry, Jeffrey W. Ohlmann, David R. AndersonPublisher:Cengage Learning
 Managerial AccountingAccountingISBN:9781337912020Author:Carl Warren, Ph.d. Cma William B. TaylerPublisher:South-Western College Pub
 Principles of Cost AccountingAccountingISBN:9781305087408Author:Edward J. Vanderbeck, Maria R. MitchellPublisher:Cengage Learning
Managerial Accounting: The Cornerstone of Busines...
Accounting
ISBN:9781337115773
Author:Maryanne M. Mowen, Don R. Hansen, Dan L. Heitger
Publisher:Cengage Learning
Cornerstones of Cost Management (Cornerstones Ser...
Accounting
ISBN:9781305970663
Author:Don R. Hansen, Maryanne M. Mowen
Publisher:Cengage Learning
Excel Applications for Accounting Principles
Accounting
ISBN:9781111581565
Author:Gaylord N. Smith
Publisher:Cengage Learning
Essentials of Business Analytics (MindTap Course ...
Statistics
ISBN:9781305627734
Author:Jeffrey D. Camm, James J. Cochran, Michael J. Fry, Jeffrey W. Ohlmann, David R. Anderson
Publisher:Cengage Learning
Managerial Accounting
Accounting
ISBN:9781337912020
Author:Carl Warren, Ph.d. Cma William B. Tayler
Publisher:South-Western College Pub
Principles of Cost Accounting
Accounting
ISBN:9781305087408
Author:Edward J. Vanderbeck, Maria R. Mitchell
Publisher:Cengage Learning
Inspection and Quality control in Manufacturing. What is quality inspection?; Author: Educationleaves;https://www.youtube.com/watch?v=Ey4MqC7Kp7g;License: Standard youtube license