
Videos
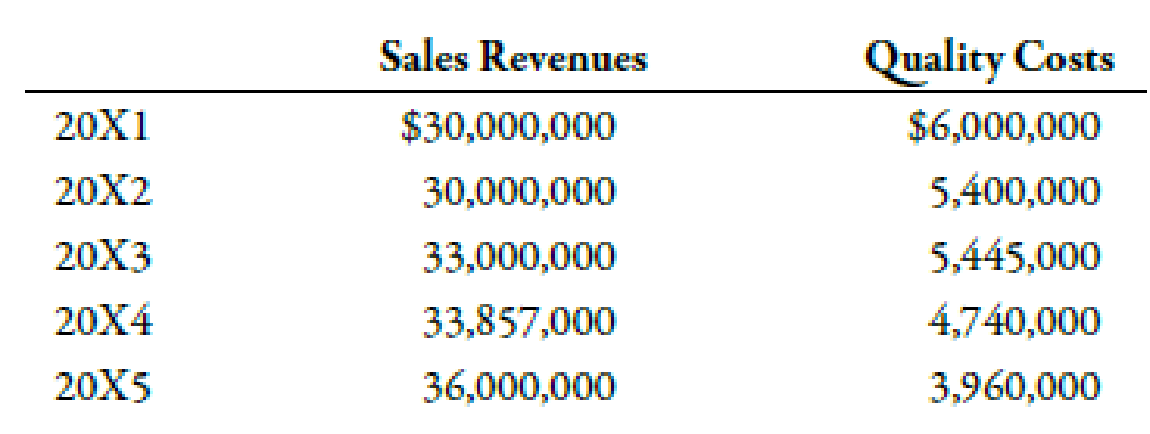
Luna Company is a printing company and a subsidiary of a large publishing company. Luna is in its fourth year of a 5-year, quality improvement program. The program began in 20X1 as a result of a report by a consulting firm that revealed that quality costs were about 20% of sales. Concerned about the level of quality costs, Luna’s top management began a 5-year plan in 20X1 with the objective of lowering quality costs to 10% of sales by the end of 20X5. Sales and quality costs for each year are as follows:
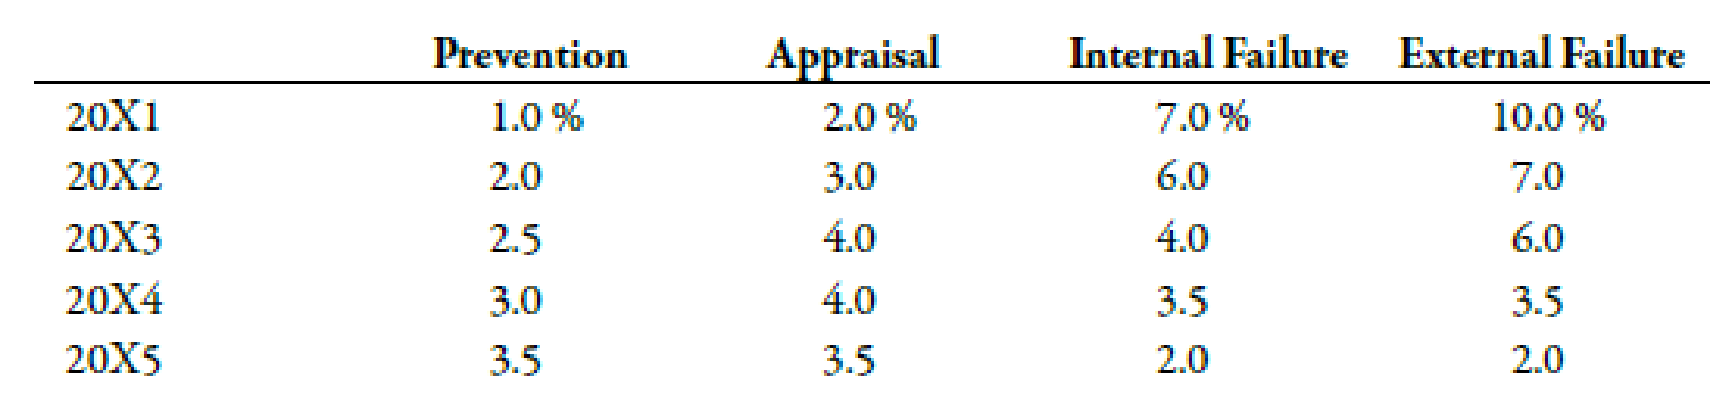
Quality costs by category are expressed as a percentage of sales as follows:
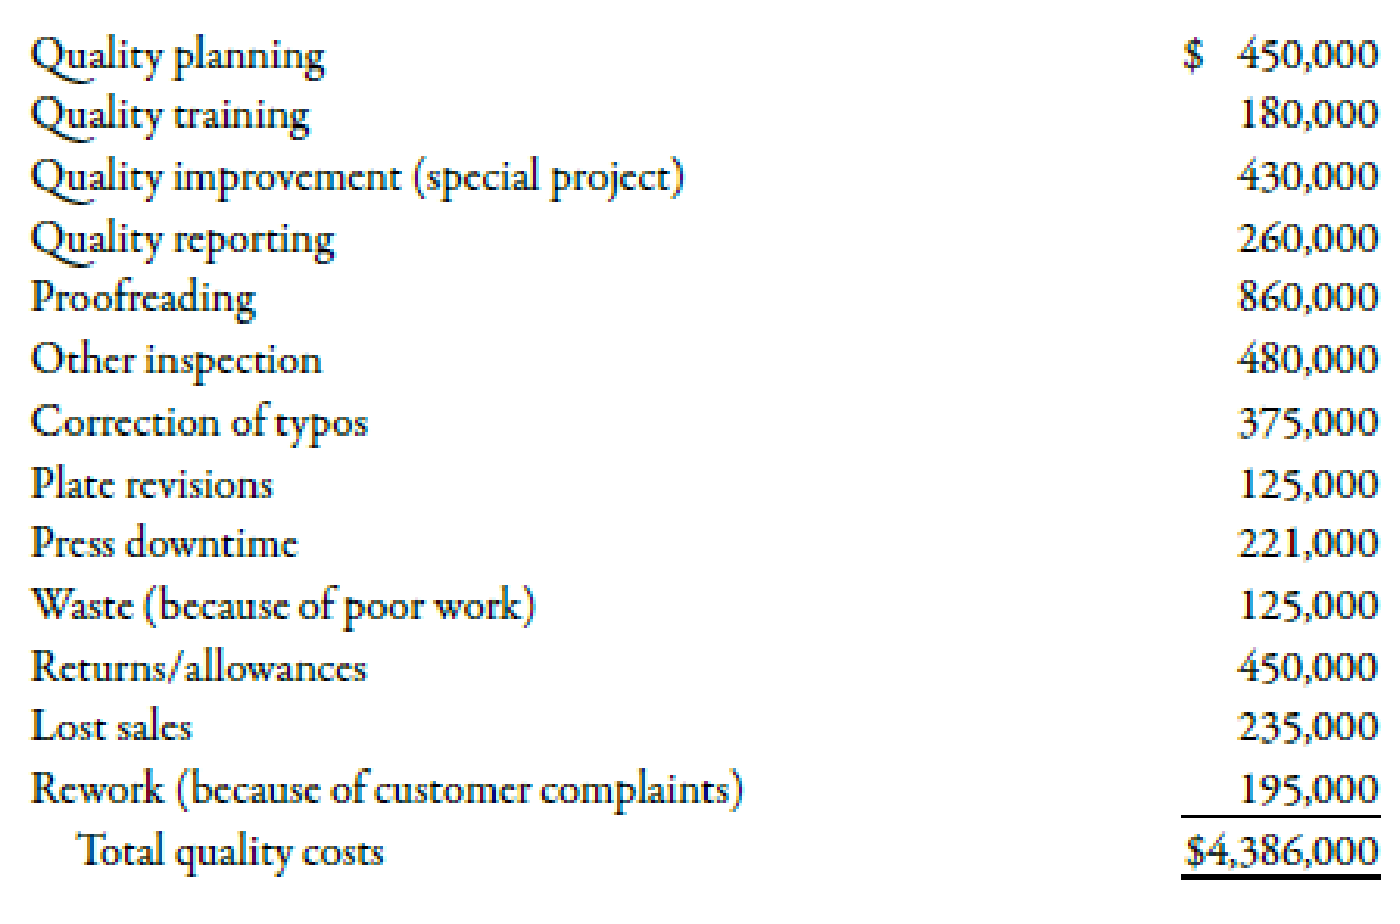
The detail of the 20X5 budget for quality costs is also provided.
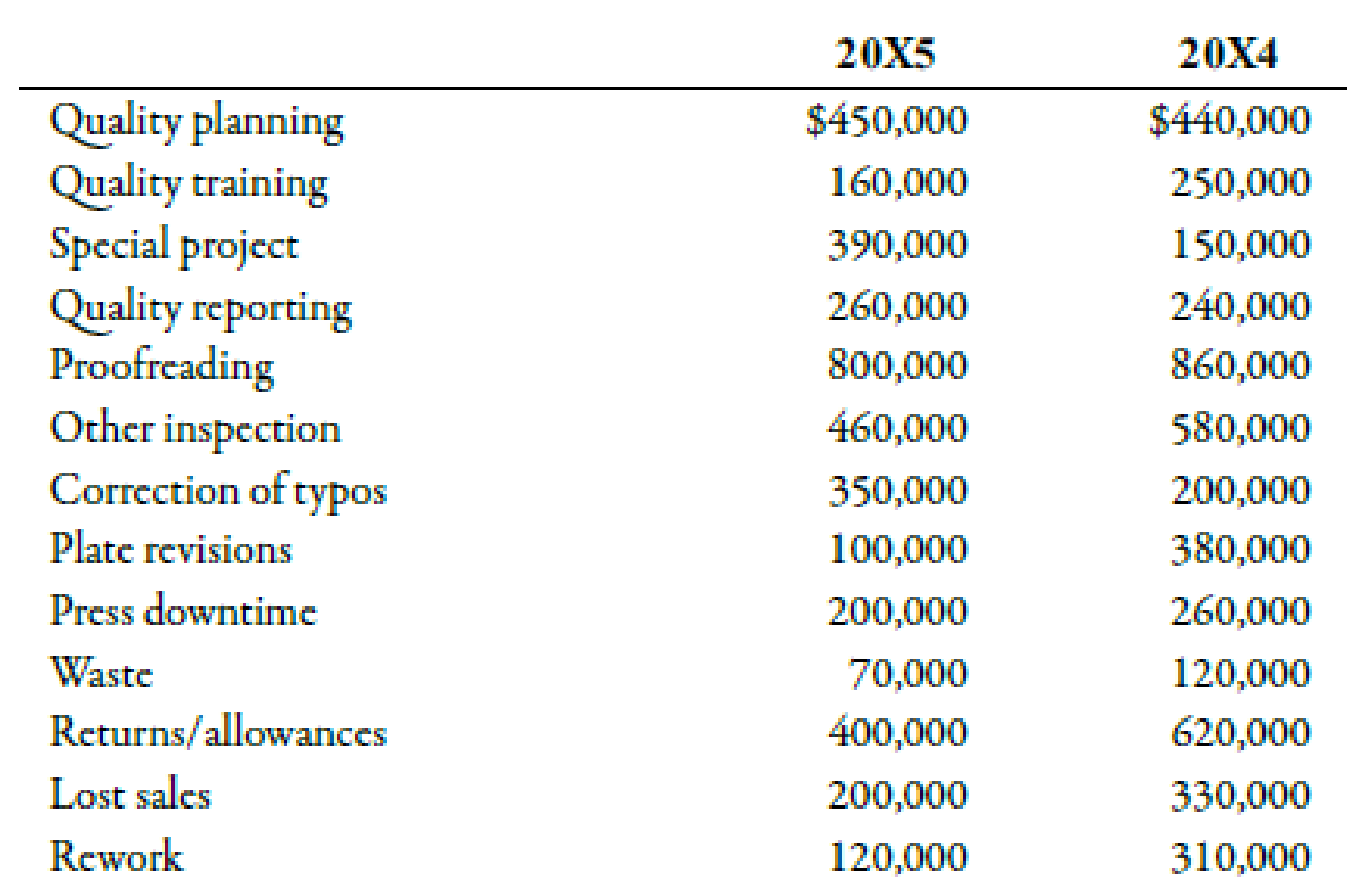
Actual quality costs for 20X4 and 20X5 are as follows:
Required:
- 1. Prepare an interim quality cost performance report for 20X5 that compares actual quality costs with budgeted quality costs. Comment on the firm’s ability to achieve its quality goals for the year.
- 2. Prepare a single-period quality performance report for 20X5 that compares the actual quality costs of 20X4 with the actual costs of 20X5. How much did profits change because of improved quality?
- 3. Prepare a graph that shows the trend in total quality costs as a percentage of sales since the inception of the quality improvement program.
- 4. Prepare a graph that shows the trend for all four quality cost categories for 20X1 through 20X5. How does this graph help management know that the reduction in total quality costs is attributable to quality improvements?
- 5. Assume that the company is preparing a second 5-year plan to reduce quality costs to 2.5% of sales. Prepare a long-range quality cost performance report that compares the costs for 20X5 with those planned for the end of the second 5-year period. Assume sales of $45 million at the end of 5 years. The final planned relative distribution of quality costs is as follows: proofreading, 50%; other inspection, 13%; quality training, 30%; and quality reporting, 7%. Assume that all prevention costs are fixed and all other costs are variable (with respect to sales).
1.
Present interim quality cost performance report.
Explanation of Solution
Quality Cost:
Organizations are required to bear costs due to non-conformity of goods or services with the general specifications. These costs are termed as quality costs. Quality costs can be categorized into preventive costs, detective costs, internal failure costs and external failure costs.
Quality cost performance report:
| Particulars |
Budgeted ($) |
Actual ($) |
Variance ($) |
| Prevention | |||
| Quality planning | 450,000 | 450,000 | 0 |
| Quality training | 180,000 | 160,000 | 20,000 |
| Special project | 430,000 | 390,000 | 40,000 |
| Quality reporting | 260,000 | 260,000 | 0 |
| Total prevention costs(A) | 1,320,000 | 1,260,000 | 60,000 |
| Appraisal | |||
| Proofreading | 860,000 | 800,000 | 60,000 |
| Other inspection | 480,000 | 460,000 | 20,000 |
| Total appraisal costs (B) | 1,340,000 | 1,260,000 | 80,000 |
| Internal Failure | |||
| Correction of typos | 375,000 | 350,000 | 25,000 |
| Plate revisions | 125,000 | 100,000 | 25,000 |
| Press downtime | 221,000 | 200,000 | 21,000 |
| Waste | 125,000 | 70,000 | 55,000 |
| Total internal failure costs (C) | 846,000 | 720,000 | 126,000 |
| External Failure | |||
| Returns/allowances | 450,000 | 400,000 | 50,000 |
| Lost sales | 235,000 | 200,000 | 35,000 |
| Rework | 195,000 | 120,000 | 75,000 |
| Total external failure costs (D) | 880,000 | 720,000 | 160,000 |
|
Total quality cost | 4,386,000 | 3,960,000 | 426,000 |
Table (1)
Total sales in the Year 20X5 are $36,000,000 and quality costs are $3,960,000 which is 11%
Therefore, the company has been able to achieve quality goals for the year.
2.
Compare actual costs of the year 20X4 with the costs of 20X5
Explanation of Solution
Quality cost performance report:
| Particulars |
Actual ($) 20X4 |
Actual ($) 20X5 |
Variance ($) |
| Prevention | |||
| Quality planning | 440,000 | 450,000 | |
| Quality training | 250,000 | 160,000 | 90,000 |
| Special project | 150,000 | 390,000 | |
| Quality reporting | 240,000 | 260,000 | |
| Total prevention costs(A) | 1,080,000 | 1,260,000 | |
| Appraisal | |||
| Proofreading | 860,000 | 800,000 | 60,000 |
| Other inspection | 580,000 | 460,000 | 120,000 |
| Total appraisal costs (B) | 1,440,000 | 1,260,000 | 180,000 |
| Internal Failure | |||
| Correction of typos | 200,000 | 350,000 | |
| Plate revisions | 380,000 | 100,000 | 280,000 |
| Press downtime | 260,000 | 200,000 | 60,000 |
| Waste | 120,000 | 70,000 | 50,000 |
| Total internal failure costs (C) | 960,000 | 720,000 | 240,000 |
| External Failure | |||
| Returns/allowances | 620,000 | 400,000 | 220,000 |
| Lost sales | 330,000 | 200,000 | 130,000 |
| Rework | 310,000 | 120,000 | 190,000 |
| Total external failure costs (D) | 1,260,000 | 720,000 | 540,000 |
|
Total quality cost | 4,740,000 | 3,960,000 | 780,000 |
Table (2)
Profit has been increased by $780,000 due to improved quality and reduction of quality.
3.
Prepare trend graph for total quality costs.
Explanation of Solution
Trend graph for total quality costs.
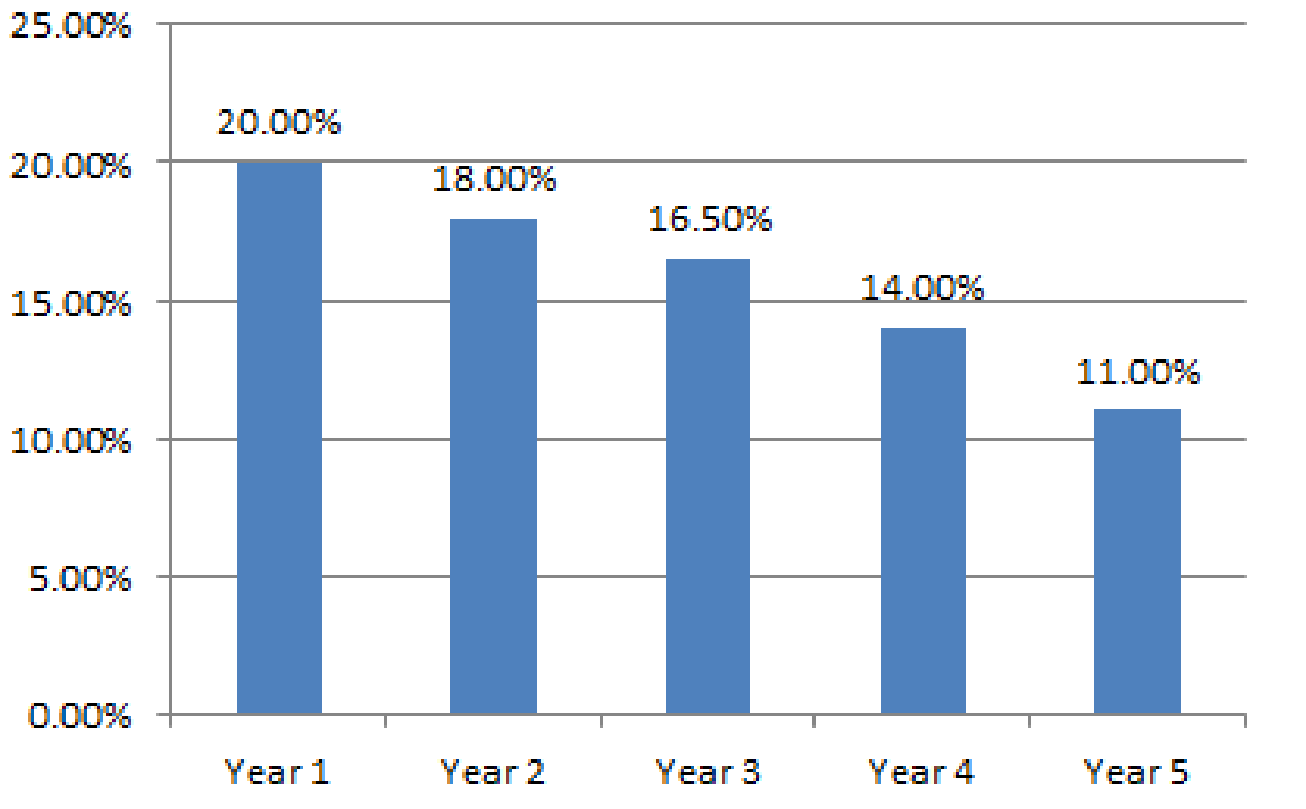
Fig (1)
4.
Prepare trend graph for the category wise quality costs.
Explanation of Solution
Prepare trend graph for category wise quality costs.
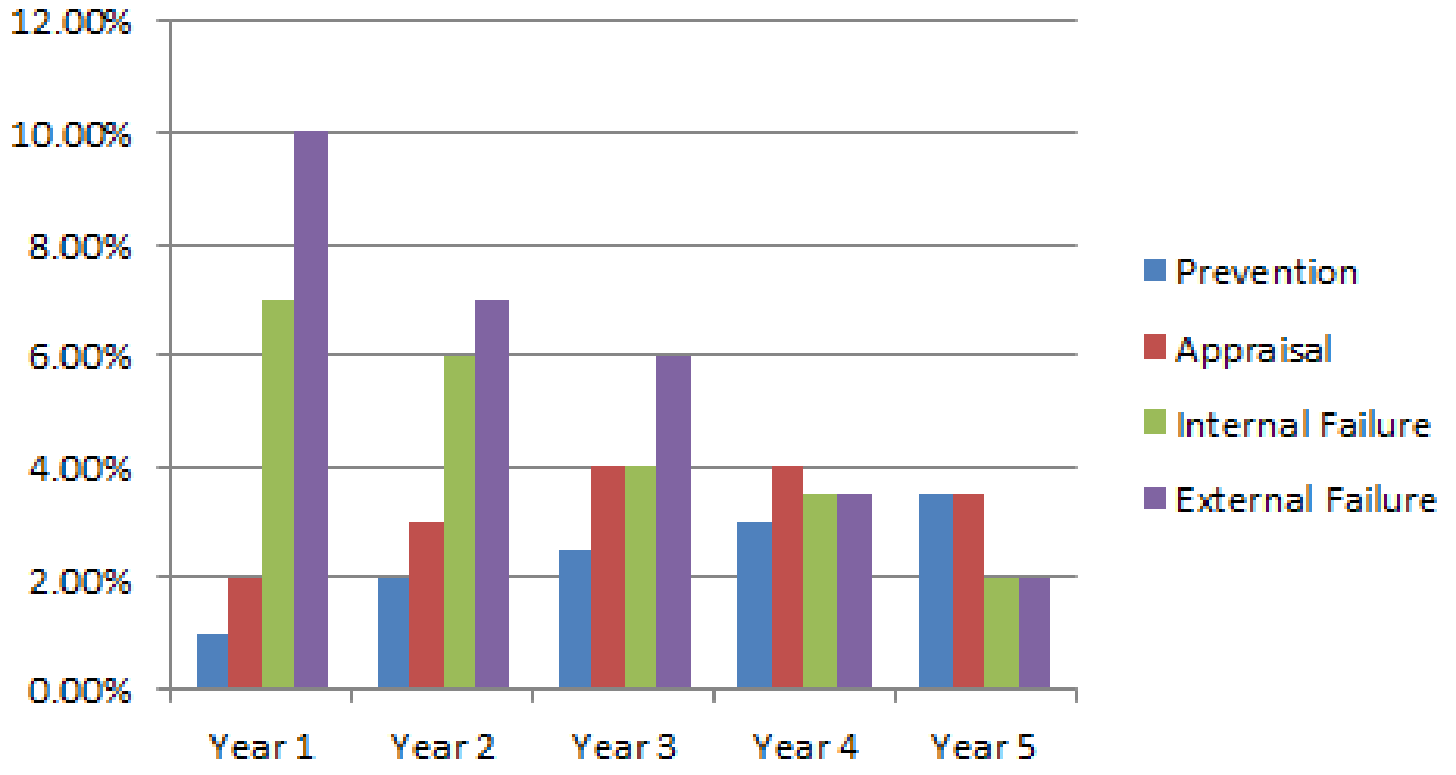
Fig (2)
Analysis of the graph:
- This graph depicts progress in quality costs.
- Prevention and detections costs have increased; whereas, failure costs have decreased, which shows a positive balance of cost incurred amongst the four categories.
- External failure costs have decreased from 10% to around 2% which is a significant progress. Similarly, internal failure costs have decreased from around 7% to 2%.
- Since, failure costs are reduced, this indicates that customers are satisfied with the product and costs like loss of sales and repairs due to poor quality have been reduced. Therefore, it can be concluded that, quality of the products have been improved.
5.
Prepare performance report by comparing actual costs of year 20X5 with costs planned in the next five years.
Explanation of Solution
Quality cost performance report:
| Particulars |
20X5 ($) (A) |
Percentage ($) (B) |
Budgeted ($) (C) |
Variance ($) |
| Prevention; | ||||
| Quality planning | 450,000 | 100% | 450,000 | 0 |
| Quality training | 160,000 | 30% | 48,000 | 112,000 |
| Special project | 390,000 | 100% | 390,000 | 0 |
| Quality reporting | 260,000 | 7% | 18,200 | 241,800 |
| Total prevention costs(A) | 1,260,000 | 906,200 | 353,800 | |
| Appraisal: | ||||
| Proofreading | 800,000 | 50% | 400,000 | 400,000 |
| Other inspection | 460,000 | 13% | 59,800 | 400,200 |
| Total appraisal costs (B) | 1,260,000 | 459,800 | 800,200 | |
| Internal Failure: | ||||
| Correction of typos | 350,000 | 125% | 437,500 | |
| Plate revisions | 100,000 | 125% | 125,000 | |
| Press downtime | 200,000 | 125% | 250,000 | |
| Waste | 70,000 | 125% | 87,500 | |
| Total internal failure costs (C) | 720,000 | 900,000 | ||
| External Failure: | ||||
| Returns/allowances | 400,000 | 125% | 500,000 | |
| Lost sales | 200,000 | 125% | 250,000 | |
| Rework | 120,000 | 125% | 150,000 | |
| Total external failure costs (D) | 720,000 | 900,000 | ||
|
Total quality cost | 3,960,000 | 3,166,000 | 794,000 |
Table (3)
Total quality cost of $3,166,000 is 7.03% of expected sales of $45,000,000
Working Notes:
Sales, for the next period is expected to be $45,000,000 which is 125% of the actual sales of 20X5 of $36,000,000.
Want to see more full solutions like this?
Chapter 13 Solutions
Managerial Accounting: The Cornerstone of Business Decision-Making


- Please see an attachment for details of this financial accountingarrow_forwardBonnie and Clyde are the only two shareholders in Getaway Corporation. Bonnie owns 60 shares with a basis of $3,000, and Clyde owns the remaining 40 shares with a basis of $12,000. At year-end, Getaway is considering different alternatives for redeeming some shares of stock. Evaluate whether each of these stock redemption transactions qualify for sale or exchange treatment. Getaway redeems 29 of Bonnie’s shares for $10,000. Getaway has $26,000 of E&P at year-end and Bonnie is unrelated to Clyde.arrow_forwardNovak supply company a newly formed corporation , incurred the following expenditures related to the land , to buildings, and to machinery and equipment. abstract company's fee for title search $1,170 architect's fee $7,133 cash paid for land and dilapidated building thereon $195,750 removal of old building $45,000 LESS: salvage $12,375 $32,625 Interest on short term loans during construction…arrow_forward
- Year Cash Flow 0 -$ 27,000 1 11,000 2 3 14,000 10,000 What is the NPV for the project if the required return is 10 percent? Note: Do not round intermediate calculations and round your answer to 2 decimal places, e.g., 32.16. NPV $ 1,873.28 At a required return of 10 percent, should the firm accept this project? No Yes What is the NPV for the project if the required return is 26 percent?arrow_forwardThe following were selected from among the transactions completed by Babcock Company during November of the current year: Nov. 3 Purchased merchandise on account from Moonlight Co., list price $85,000, trade discount 25%, terms FOB destination, 2/10, n/30. 4 Sold merchandise for cash, $37,680. The cost of the goods sold was $22,600. 5 Purchased merchandise on account from Papoose Creek Co., $47,500, terms FOB shipping point, 2/10, n/30, with prepaid freight of $810 added to the invoice. 6 Returned merchandise with an invoice amount of $13,500 ($18,000 list price less trade discount of 25%) purchased on November 3 from Moonlight Co. 8 Sold merchandise on account to Quinn Co., $15,600 with terms n/15. The cost of the goods sold was $9,400. 13 Paid Moonlight Co. on account for purchase of November 3, less return of November 6. 14 Sold merchandise with a list price of $236,000 to customers who used VISA and who redeemed $8,000 of pointof- sale coupons. The cost…arrow_forwardHello teacher please solve this questionsarrow_forward
 Managerial Accounting: The Cornerstone of Busines...AccountingISBN:9781337115773Author:Maryanne M. Mowen, Don R. Hansen, Dan L. HeitgerPublisher:Cengage Learning
 Cornerstones of Cost Management (Cornerstones Ser...AccountingISBN:9781305970663Author:Don R. Hansen, Maryanne M. MowenPublisher:Cengage Learning