![Managerial Accounting: The Cornerstone of Business Decision-Making](https://www.bartleby.com/isbn_cover_images/9781337115773/9781337115773_largeCoverImage.gif)
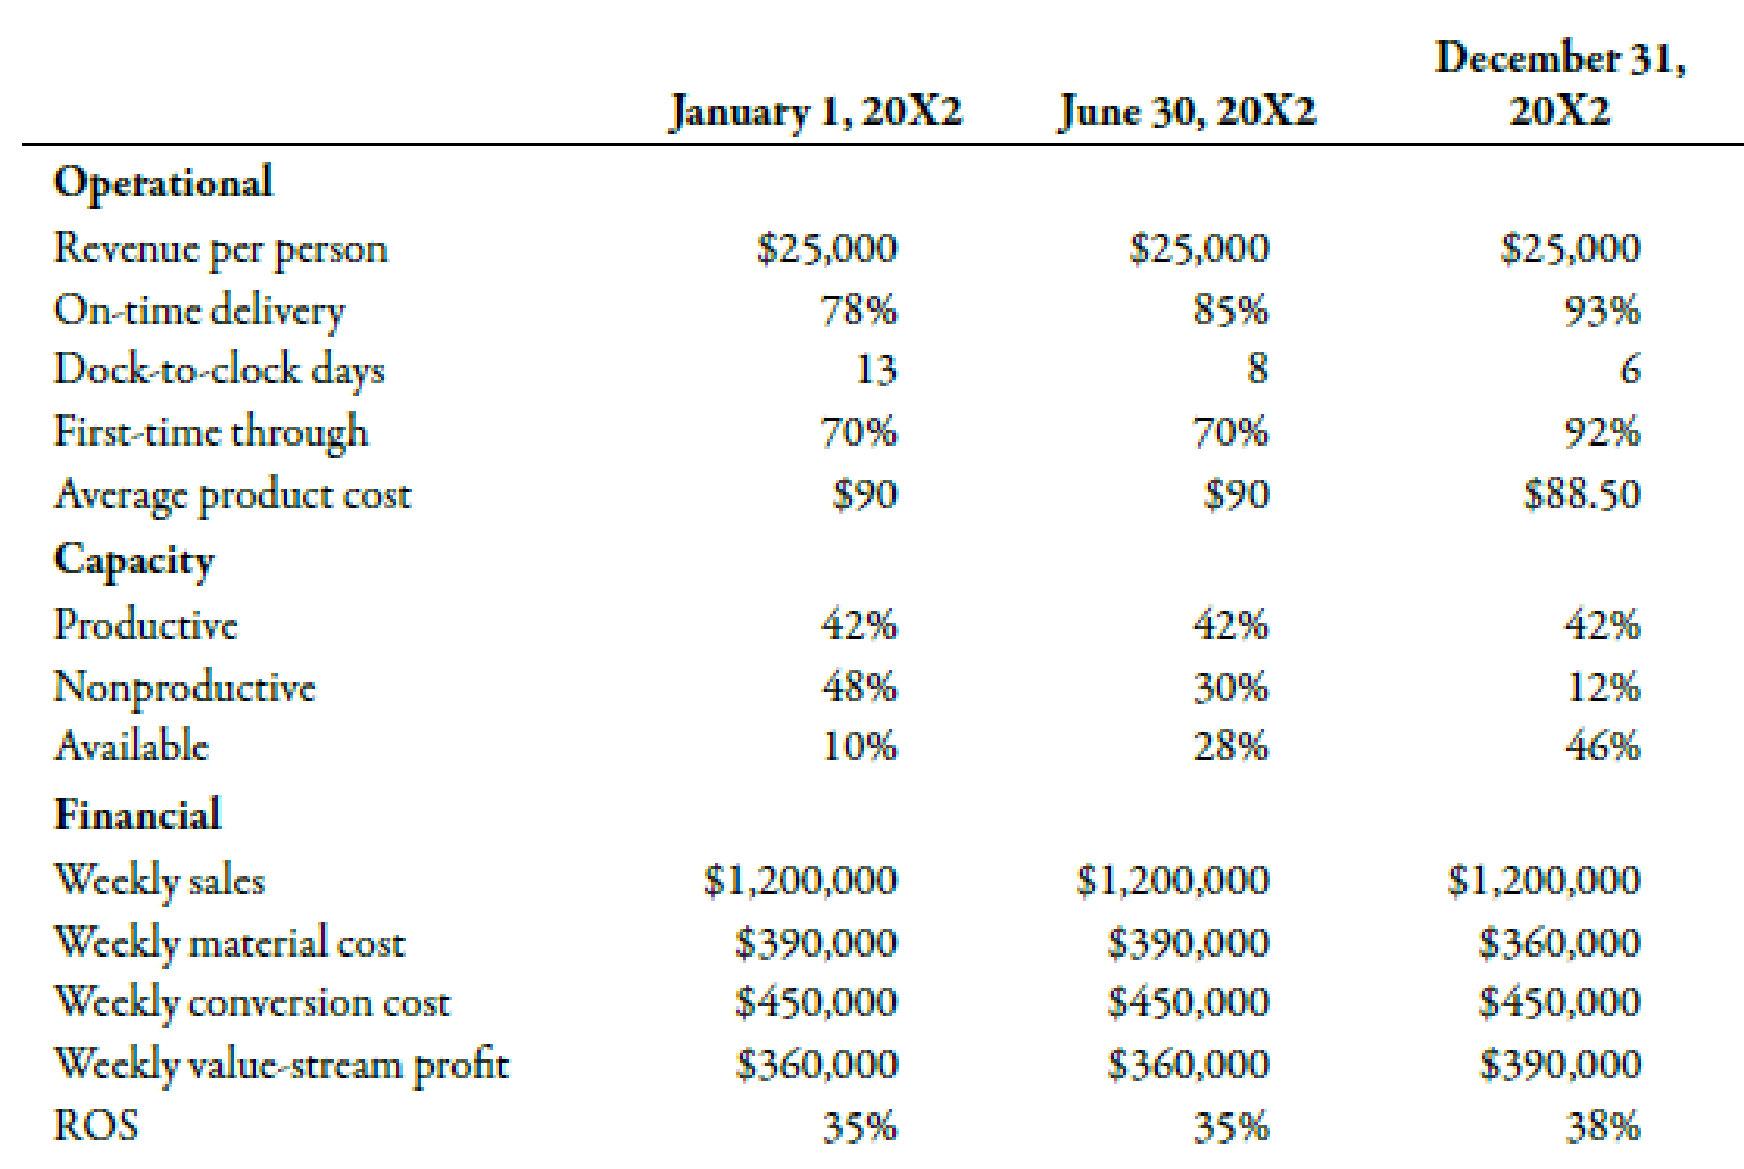
Merkley Company, a manufacturer of machine parts, implemented lean manufacturing at the end of 20X1. Three value streams were established: one for new product development and two order fulfillment value streams. One of the value streams set a goal to increase its ROS to 45% of sales by the end of the year. During the year, the value stream made significant improvements in several areas. The Box Scorecard below was prepared, with performance measures for the beginning of the year, midyear, and end of year. Although the members of the value stream were pleased with their progress, they were disappointed in the financial results. They were still far from the targeted ROS of 45%. They were also puzzled as to why the improvements made did not translate into significantly improved financial performance.
Required:
- 1. From the scorecard, what was the focus of the value-stream team for the first 6 months? The second 6 months? What are the implications of these changes?
- 2. Using information from the scorecard, offer an explanation for why the financial results were not as good as expected.
![Check Mark](/static/check-mark.png)
Want to see the full answer?
Check out a sample textbook solution![Blurred answer](/static/blurred-answer.jpg)
Chapter 13 Solutions
Managerial Accounting: The Cornerstone of Business Decision-Making
- Bradford Company, a manufacturer of small tools, implemented lean manufacturing at the end of 20x1. The companys goal for the year was to increase the ROS to 40 percent of sales. A value-stream team was established and began to work on lean improvements. During the year, the team was able to achieve significant results on several fronts. The Box Scorecard below reflects the performance measures at the beginning of the year, midyear, and end of year. Although the team members were pleased with their progress, they were disappointed in the financial results. They were still far from the targeted ROS of 40 percent. They were also puzzled as to why the improvements made did not translate into significantly improved financial performance. Required: 1. From the scorecard, what was the focus of the value-stream team for the first six months? The second six months? What are the implications of these changes? 2. Using information from the scorecard, offer an explanation for why the financial results were not as good as expected. 3. Suppose that on December 31, 20x2, a potential customer offered to purchase an order of goods that would increase weekly revenues in January by 100,000 and material cost by 30,000. Using the old standard cost system, the projected conversion cost of the order would be 60,000. Would you recommend that the order be accepted or rejected? Explain.arrow_forwardAt the end of 20x1, Mejorar Company implemented a low-cost strategy to improve its competitive position. Its objective was to become the low-cost producer in its industry. A Balanced Scorecard was developed to guide the company toward this objective. To lower costs, Mejorar undertook a number of improvement activities such as JIT production, total quality management, and activity-based management. Now, after two years of operation, the president of Mejorar wants some assessment of the achievements. To help provide this assessment, the following information on one product has been gathered: Required: 1. Compute the following measures for 20x1 and 20x3: a. Actual velocity and cycle time b. Percentage of total revenue from new customers (assume one unit per customer) c. Percentage of very satisfied customers (assume each customer purchases one unit) d. Market share e. Percentage change in actual product cost (for 20x3 only) f. Percentage change in days of inventory (for 20x3 only) g. Defective units as a percentage of total units produced h. Total hours of training i. Suggestions per production worker j. Total revenue k. Number of new customers 2. For the measures listed in Requirement 1, list likely strategic objectives, classified according to the four Balance Scorecard perspectives. Assume there is one measure per objective.arrow_forwardThe controller of Emery, Inc. has computed quality costs as a percentage of sales for the past 5 years (20X1 was the first year the company implemented a quality improvement program). This information is as follows: Required: 1. Prepare a trend graph for total quality costs. Comment on what the graph has to say about the success of the quality improvement program. 2. Prepare a graph that shows the trend for each quality cost category. What does the graph have to say about the success of the quality improvement program? Does this graph supply more insight than the total cost trend graph does? 3. Prepare a graph that compares the trend in relative control costs versus relative failure costs. Comment on the significance of this trend.arrow_forward
- Pintura Company implemented a quality improvement program and tracked the following for the five years: By cost category as a percentage of sales for the same period of time: Required: 1. Prepare a bar graph that reveals the trend in quality cost as a percentage of sales (time on the horizontal axis and percentages on the vertical). Comment on the message of the graph. 2. Prepare a bar graph for each cost category as a percentage of sales. What does this graph tell you?arrow_forwardRoss Company implemented a quality improvement program and tracked the following for the five years: By cost category as a percentage of sales for the same period of time: Required: 1. Prepare a bar graph that reveals the trend in quality cost as a percentage of sales (time on the horizontal axis and percentages on the vertical). Comment on the message of the graph. 2. Prepare a bar graph for each cost category as a percentage of sales. What does this graph tell you? 3. What if management would like to have the trend in relative distribution of quality costs? Express this as a bar graph and comment on its significance.arrow_forwardNorris Company implemented a quality improvement program and tracked the following for the 5 years: By cost category of sales for the same period of time: Required: 1. Prepare a bar graph (hat reveals the trend in quality cost as a percentage of sales (time on horizontal axis and percentages on the vertical). Comment on the message of the graph. 2. Prepare a bar graph for each cost category as a percentage of sales. What does this graph tell you?arrow_forward
- Recognising that there would be fierce competition to regain lost markets, Management felt that there should be a renewed focus on the productivity and profitability of the operations. The productivity analysis would focus on the Manufacturing department, and the profitability would examine both products. To conduct this analysis, you have extracted the following information for the Manufacturing Department for the month of January: At the start of the month there were 1,000 units in stock, which were 20% complete with respect to conversion costs, and was valued at $ 16,000. During the month, 9,000 units were introduced to the production. At the end of the month there were 1,000 units in stock which were 40% complete with respect to conversion costs. All Materials are added at the start of the process. Costs incurred for the month were: Materials - $ 63,000; Conversion costs - $ 139,840. The Department uses a FIFO costing system. Further examination of the records showed the…arrow_forwardPlease help me to solve this problemarrow_forwardJavier Company has sales of 8 million and quality costs of 1,600,000. The company is embarking on a major quality improvement program. During the next three years, Javier intends to attack failure costs by increasing its appraisal and prevention costs. The right prevention activities will be selected, and appraisal costs will be reduced according to the results achieved. For the coming year, management is considering six specific activities: quality training, process control, product inspection, supplier evaluation, prototype testing, and redesign of two major products. To encourage managers to focus on reducing non-value-added quality costs and select the right activities, a bonus pool is established relating to reduction of quality costs. The bonus pool is equal to 10 percent of the total reduction in quality costs. Current quality costs and the costs of these six activities are given in the following table. Each activity is added sequentially so that its effect on the cost categories can be assessed. For example, after quality training is added, the control costs increase to 320,000, and the failure costs drop to 1,040,000. Even though the activities are presented sequentially, they are totally independent of each other. Thus, only beneficial activities need be selected. Required: 1. Identify the control activities that should be implemented, and calculate the total quality costs associated with this selection. Assume that an activity is selected only if it increases the bonus pool. 2. Given the activities selected in Requirement 1, calculate the following: a. The reduction in total quality costs b. The percentage distribution for control and failure costs c. The amount for this years bonus pool 3. Suppose that a quality engineer complained about the gainsharing incentive system. Basically, he argued that the bonus should be based only on reductions of failure and appraisal costs. In this way, investment in prevention activities would be encouraged, and eventually, failure and appraisal costs would be eliminated. After eliminating the non-value-added costs, focus could then be placed on the level of prevention costs. If this approach were adopted, what activities would be selected? Do you agree or disagree with this approach? Explain.arrow_forward
- In 20x5, Major Company initiated a full-scale, quality improvement program. At the end of the year, Jack Aldredge, the president, noted with some satisfaction that the defects per unit of product had dropped significantly compared to the prior year. He was also pleased that relationships with suppliers had improved and defective materials had declined. The new quality training program was also well accepted by employees. Of most interest to the president, however, was the impact of the quality improvements on profitability. To help assess the dollar impact of the quality improvements, the actual sales and the actual quality costs for 20x4 and 20x5 are as follows by quality category: All prevention costs are fixed (by discretion). Assume all other quality costs are unit-level variable. Required: 1. Compute the relative distribution of quality costs for each year and prepare a pie chart. Do you believe that the company is moving in the right direction in terms of the balance among the quality cost categories? Explain. 2. Prepare a one-year trend performance report for 20x5 (compare the actual costs of 20x5 with those of 20x4, adjusted for differences in sales volume). How much have profits increased because of the quality improvements made by Major Company? 3. Estimate the additional improvement in profits if Major Company ultimately reduces its quality costs to 2.5 percent of sales revenues (assume sales of 10 million).arrow_forwardForchen, Inc., provided the following information for two of its divisions for last year: Required: 1. For the Small Appliances Division, calculate: a. Average operating assets b. Margin c. Turnover d. Return on investment (ROI) 2. For the Cleaning Products Division, calculate: a. Average operating assets b. Margin c. Turnover d. Return on investment (ROI) 3. What if operating income for the Small Appliances Division was 2,000,000? How would that affect average operating assets? Margin? Turnover? ROI? Calculate any changed ratios (round to four significant digits).arrow_forwardEvans Company had total sales of 3,000,000 for fiscal 20x5. The costs of quality-related activities are given below. Required: 1. Prepare a quality cost report, classifying costs by category and expressing each category as a percentage of sales. What message does the cost report provide? 2. Prepare a bar graph and pie chart that illustrate each categorys contribution to total quality costs. Comment on the significance of the distribution. 3. What if, five years from now, quality costs are 7.5 percent of sales, with control costs being 65 percent of the total quality costs? What would your conclusion be?arrow_forward
- Managerial Accounting: The Cornerstone of Busines...AccountingISBN:9781337115773Author:Maryanne M. Mowen, Don R. Hansen, Dan L. HeitgerPublisher:Cengage LearningCornerstones of Cost Management (Cornerstones Ser...AccountingISBN:9781305970663Author:Don R. Hansen, Maryanne M. MowenPublisher:Cengage LearningEssentials of Business Analytics (MindTap Course ...StatisticsISBN:9781305627734Author:Jeffrey D. Camm, James J. Cochran, Michael J. Fry, Jeffrey W. Ohlmann, David R. AndersonPublisher:Cengage Learning
- Managerial AccountingAccountingISBN:9781337912020Author:Carl Warren, Ph.d. Cma William B. TaylerPublisher:South-Western College PubFinancial And Managerial AccountingAccountingISBN:9781337902663Author:WARREN, Carl S.Publisher:Cengage Learning,
![Text book image](https://www.bartleby.com/isbn_cover_images/9781337115773/9781337115773_smallCoverImage.gif)
![Text book image](https://www.bartleby.com/isbn_cover_images/9781305970663/9781305970663_smallCoverImage.gif)
![Text book image](https://www.bartleby.com/isbn_cover_images/9781305627734/9781305627734_smallCoverImage.gif)
![Text book image](https://www.bartleby.com/isbn_cover_images/9781337912020/9781337912020_smallCoverImage.jpg)
![Text book image](https://www.bartleby.com/isbn_cover_images/9781337902663/9781337902663_smallCoverImage.jpg)