
Statistics for Business and Economics (13th Edition)
13th Edition
ISBN: 9780134506593
Author: James T. McClave, P. George Benson, Terry Sincich
Publisher: PEARSON
expand_more
expand_more
format_list_bulleted
Concept explainers
Videos
Textbook Question
Chapter 12.6, Problem 12.53LM
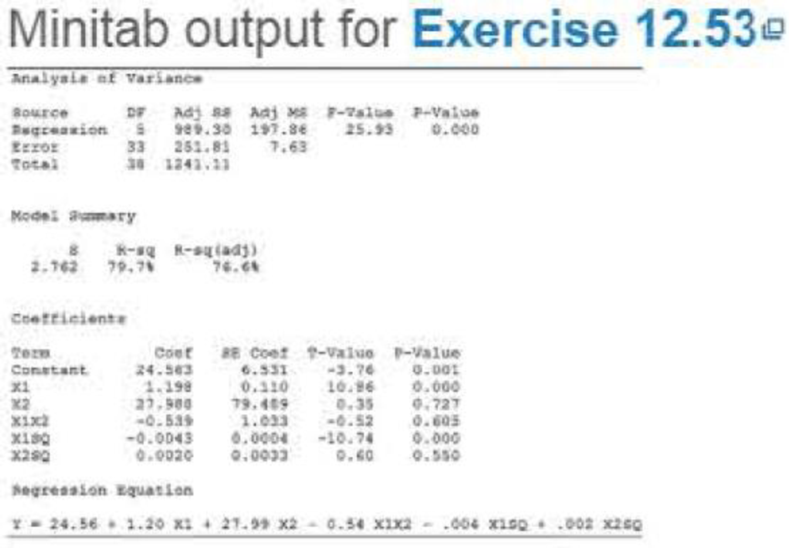
Minitab was used to fit the complete second-order model
E(y) = β0 + β1x1 + β2x2 + β3x1x2 + β4
to n = 39 data points. The printout is shown on the next page.
- a. Is there sufficient evidence to indicate that at least one of the parameters—β1, β2, β3, β4, and β5—is nonzero? Test using α =.05.
- b. Test H0 : β4 = 0 against Ha : β4 ≠ 0. Use α =.01.
- c. Test H0 : β5 = 0 against Ha : β4 ≠ 0. Use α =.01.
- d. Use graphs to explain the consequences of the tests in parts b and c.
Expert Solution & Answer
Want to see the full answer?
Check out a sample textbook solution
Students have asked these similar questions
A major company in the Montreal area, offering a range of engineering services from project preparation to construction execution, and industrial project management, wants to ensure that the individuals who are responsible for project cost estimation and bid preparation demonstrate a certain uniformity in their estimates. The head of civil engineering and municipal services decided to structure an experimental plan to detect if there could be significant differences in project evaluation.
Seven projects were selected, each of which had to be evaluated by each of the two estimators, with the order of the projects submitted being random. The obtained estimates are presented in the table below.
a) Complete the table above by calculating: i. The differences (A-B) ii. The sum of the differences iii. The mean of the differences iv. The standard deviation of the differences
b) What is the value of the t-statistic?
c) What is the critical t-value for this test at a significance level of 1%?…
Compute the relative risk of falling for the two groups (did not stop walking vs. did stop). State/interpret your result verbally.
Microsoft Excel include formulas
Chapter 12 Solutions
Statistics for Business and Economics (13th Edition)
Ch. 12.3 - Write a first-order model relating E(y) to a. two...Ch. 12.3 - Minitab was used to fit the model E(y) = (0 + 1x1...Ch. 12.3 - Suppose you fit the multiple regression model y =0...Ch. 12.3 - Suppose you fit the first-order multiple...Ch. 12.3 - Prob. 12.5LMCh. 12.3 - Prob. 12.6LMCh. 12.3 - Prob. 12.7LMCh. 12.3 - If the analysis of variance F-test leads to the...Ch. 12.3 - Ambiance of 5-star hotels. Although invisible and...Ch. 12.3 - Forecasting movie revenues with Twitter. Refer to...
Ch. 12.3 - Accounting and Machiavellianism. Refer to the...Ch. 12.3 - Prob. 12.12ACBCh. 12.3 - Predicting elements in aluminum alloys. Aluminum...Ch. 12.3 - Novelty of a vacation destination. Many tourists...Ch. 12.3 - Arsenic in groundwater. Environmental Science ...Ch. 12.3 - Reality TV and cosmetic surgery. How much...Ch. 12.3 - Contamination from a plant's discharge. Refer to...Ch. 12.3 - Cooling method for gas turbines. Refer to the...Ch. 12.3 - Rankings of research universities. Refer to the...Ch. 12.3 - Bubble behavior in subcooled flow boiling. In...Ch. 12.3 - Prob. 12.22ACICh. 12.3 - Prob. 12.23ACACh. 12.3 - Prob. 12.24ACACh. 12.4 - Characteristics of lead users. Refer to the...Ch. 12.4 - Prob. 12.26ACBCh. 12.4 - Reality TV and cosmetic surgery. Refer to the Body...Ch. 12.4 - Chemical plant contamination. Refer to Exercise...Ch. 12.4 - Prob. 12.29ACBCh. 12.4 - Arsenic in groundwater. Refer to the Environmental...Ch. 12.4 - Prob. 12.32ACICh. 12.4 - Prob. 12.33ACICh. 12.4 - Boiler drum production. In a production facility,...Ch. 12.5 - Suppose the true relationship between E(y) and the...Ch. 12.5 - Suppose you fit the interaction model y = 0 + x1 +...Ch. 12.5 - Prob. 12.37LMCh. 12.5 - Tipping behavior in restaurants. Can food servers...Ch. 12.5 - Forecasting movie revenues with Twitter. Refer to...Ch. 12.5 - Prob. 12.41ACBCh. 12.5 - Prob. 12.42ACBCh. 12.5 - Reality TV and cosmetic surgery. Refer to the Body...Ch. 12.5 - Factors that impact an auditors judgment. A study...Ch. 12.5 - Service workers and customer relations. A study in...Ch. 12.5 - Bubble behavior in subcooled flow boiling. Refer...Ch. 12.5 - Arsenic in groundwater. Refer to the Environmental...Ch. 12.5 - Cooling method for gas turbines. Refer to the...Ch. 12.6 - Write a second-order model relating the mean of y,...Ch. 12.6 - Prob. 12.50LMCh. 12.6 - Prob. 12.51LMCh. 12.6 - Prob. 12.52LMCh. 12.6 - Minitab was used to fit the complete second-order...Ch. 12.6 - Personality traits and job performance. When...Ch. 12.6 - Going for it on fourth-down in the NFL. Refer to...Ch. 12.6 - Prob. 12.56ACBCh. 12.6 - Prob. 12.57ACBCh. 12.6 - Assertiveness and leadership. Management...Ch. 12.6 - Goal congruence in top management teams. Do chief...Ch. 12.6 - Prob. 12.60ACICh. 12.6 - Revenues of popular movies. The Internet Movie...Ch. 12.6 - Prob. 12.62ACICh. 12.6 - Prob. 12.63ACICh. 12.6 - Prob. 12.64ACICh. 12.6 - Prob. 12.65ACICh. 12.7 - Write a regression model relating the mean value...Ch. 12.7 - Prob. 12.67LMCh. 12.7 - Prob. 12.68LMCh. 12.7 - Prob. 12.69LMCh. 12.7 - Prob. 12.70ACBCh. 12.7 - Prob. 12.71ACBCh. 12.7 - Prob. 12.72ACBCh. 12.7 - Prob. 12.73ACBCh. 12.7 - Buy-side vs. sell-side analysts earnings...Ch. 12.7 - Prob. 12.75ACBCh. 12.7 - Charisma of top-level leaders. Refer to the...Ch. 12.7 - Corporate sustainability and firm characteristics....Ch. 12.7 - Homework assistance for accounting students. Refer...Ch. 12.7 - Improving driving performance while fatigued....Ch. 12.7 - Prob. 12.80ACACh. 12.7 - Banning controversial sports team sponsors. Refer...Ch. 12.8 - Consider a multiple regression model for a...Ch. 12.8 - Prob. 12.83LMCh. 12.8 - Consider the model: y = 0+ 1x1+ 2 x2+ 3 x3+...Ch. 12.8 - Consider the model:...Ch. 12.8 - Prob. 12.86LMCh. 12.8 - Reality TV and cosmetic surgery. Refer to the Body...Ch. 12.8 - Do blondes raise more funds? Refer to the Economic...Ch. 12.8 - Prob. 12.89ACBCh. 12.8 - Buy-side vs. sell-side analysts earnings...Ch. 12.8 - Workplace bullying and intention to leave....Ch. 12.8 - Agreeableness, gender, and wages. Do agreeable...Ch. 12.8 - Chemical plant contamination. Refer to Exercise...Ch. 12.8 - Prob. 12.94ACICh. 12.8 - Recently sold, single-family homes. The National...Ch. 12.8 - Charisma of top-level leaders Refer to the Academy...Ch. 12.9 - Determine which pairs of the following models are...Ch. 12.9 - Prob. 12.98LMCh. 12.9 - Prob. 12.99LMCh. 12.9 - Shared leadership in airplane crews. Refer to the...Ch. 12.9 - Buy-side vs. sell-side analysts earnings...Ch. 12.9 - Workplace bullying and intention to leave. Refer...Ch. 12.9 - Cooling method for gas turbines. Refer to the...Ch. 12.9 - Prob. 12.104ACBCh. 12.9 - Reality TV and cosmetic surgery. Refer to the Body...Ch. 12.9 - Study of supervisor-targeted aggression....Ch. 12.9 - Prob. 12.107ACICh. 12.9 - Recently sold, single-family homes. Refer to the...Ch. 12.9 - Prob. 12.109ACICh. 12.9 - Prob. 12.110ACACh. 12.10 - Prob. 12.111LMCh. 12.10 - Teacher pay and pupil performance. In Economic...Ch. 12.10 - Risk management performance. An article in the...Ch. 12.10 - Accuracy of software effort estimates....Ch. 12.10 - Diet of ducks bred for broiling. Corn is high in...Ch. 12.10 - Reality TV and cosmetic surgery. Refer to the Body...Ch. 12.10 - Prob. 12.117ACICh. 12.10 - Prob. 12.118ACICh. 12.10 - Prob. 12.119ACICh. 12.12 - Identify the problem(s) in each of the residual...Ch. 12.12 - Consider fitting the multiple regression model...Ch. 12.12 - Emotional intelligence and team performance. Refer...Ch. 12.12 - State casket sales restrictions. Some states...Ch. 12.12 - Personality traits and job performance. Refer to...Ch. 12.12 - Women in top management. Refer to the Journal of...Ch. 12.12 - Accuracy of software effort estimates. Refer to...Ch. 12.12 - Arsenic in groundwater. Refer to the Environmental...Ch. 12.12 - Reality TV and cosmetic surgery. Refer to the Body...Ch. 12.12 - Failure times of silicon wafer microchips. Refer...Ch. 12.12 - Bubble behavior in subcooled flow boiling. Refer...Ch. 12.12 - Banning controversial sports team sponsors. Refer...Ch. 12.12 - Cooling method for gas turbines. Refer to the...Ch. 12.12 - Agreeableness, gender, and wages. Refer to the...Ch. 12 - Suppose you have developed a regression model to...Ch. 12 - When a multiple regression model is used for...Ch. 12 - Suppose you fit the model y=0+1x1+2x12+3x2+4x1x2+...Ch. 12 - Prob. 12.137LMCh. 12 - Prob. 12.138LMCh. 12 - Prob. 12.139LMCh. 12 - Prob. 12.140LMCh. 12 - Prob. 12.141LMCh. 12 - Prob. 12.142LMCh. 12 - Prob. 12.143LMCh. 12 - Prob. 12.144LMCh. 12 - Comparing private and public college tuition....Ch. 12 - Prob. 12.146ACBCh. 12 - Prob. 12.147ACBCh. 12 - Highway crash data analysis. Researchers at...Ch. 12 - Prob. 12.149ACBCh. 12 - Mental health of a community. An article in the...Ch. 12 - Prob. 12.151ACBCh. 12 - Testing tires for wear. Underinflated or...Ch. 12 - Prob. 12.153ACBCh. 12 - Prob. 12.154ACBCh. 12 - Prob. 12.155ACBCh. 12 - Prob. 12.156ACBCh. 12 - Prob. 12.157ACBCh. 12 - Promotion of supermarket vegetables. A supermarket...Ch. 12 - Yield strength of steel alloy. Industrial...Ch. 12 - Prob. 12.160ACICh. 12 - Prob. 12.161ACICh. 12 - Improving Math SAT scores. Refer to the Chance...Ch. 12 - Prob. 12.163ACICh. 12 - Prob. 12.164ACICh. 12 - Prob. 12.165ACICh. 12 - Prob. 12.166ACICh. 12 - Sale prices of apartments. A Minneapolis,...Ch. 12 - Volatility of foreign stocks. The relationship...Ch. 12 - Prob. 12.169ACICh. 12 - Prob. 12.170ACICh. 12 - State casket sales restrictions Refer to the...Ch. 12 - Modeling monthly collision claims. A medium-sized...Ch. 12 - Developing a model for college GPA. Many colleges...
Knowledge Booster


Learn more about
Need a deep-dive on the concept behind this application? Look no further. Learn more about this topic, statistics and related others by exploring similar questions and additional content below.Similar questions
- Question 1 The data shown in Table 1 are and R values for 24 samples of size n = 5 taken from a process producing bearings. The measurements are made on the inside diameter of the bearing, with only the last three decimals recorded (i.e., 34.5 should be 0.50345). Table 1: Bearing Diameter Data Sample Number I R Sample Number I R 1 34.5 3 13 35.4 8 2 34.2 4 14 34.0 6 3 31.6 4 15 37.1 5 4 31.5 4 16 34.9 7 5 35.0 5 17 33.5 4 6 34.1 6 18 31.7 3 7 32.6 4 19 34.0 8 8 33.8 3 20 35.1 9 34.8 7 21 33.7 2 10 33.6 8 22 32.8 1 11 31.9 3 23 33.5 3 12 38.6 9 24 34.2 2 (a) Set up and R charts on this process. Does the process seem to be in statistical control? If necessary, revise the trial control limits. [15 pts] (b) If specifications on this diameter are 0.5030±0.0010, find the percentage of nonconforming bearings pro- duced by this process. Assume that diameter is normally distributed. [10 pts] 1arrow_forward4. (5 pts) Conduct a chi-square contingency test (test of independence) to assess whether there is an association between the behavior of the elderly person (did not stop to talk, did stop to talk) and their likelihood of falling. Below, please state your null and alternative hypotheses, calculate your expected values and write them in the table, compute the test statistic, test the null by comparing your test statistic to the critical value in Table A (p. 713-714) of your textbook and/or estimating the P-value, and provide your conclusions in written form. Make sure to show your work. Did not stop walking to talk Stopped walking to talk Suffered a fall 12 11 Totals 23 Did not suffer a fall | 2 Totals 35 37 14 46 60 Tarrow_forwardQuestion 2 Parts manufactured by an injection molding process are subjected to a compressive strength test. Twenty samples of five parts each are collected, and the compressive strengths (in psi) are shown in Table 2. Table 2: Strength Data for Question 2 Sample Number x1 x2 23 x4 x5 R 1 83.0 2 88.6 78.3 78.8 3 85.7 75.8 84.3 81.2 78.7 75.7 77.0 71.0 84.2 81.0 79.1 7.3 80.2 17.6 75.2 80.4 10.4 4 80.8 74.4 82.5 74.1 75.7 77.5 8.4 5 83.4 78.4 82.6 78.2 78.9 80.3 5.2 File Preview 6 75.3 79.9 87.3 89.7 81.8 82.8 14.5 7 74.5 78.0 80.8 73.4 79.7 77.3 7.4 8 79.2 84.4 81.5 86.0 74.5 81.1 11.4 9 80.5 86.2 76.2 64.1 80.2 81.4 9.9 10 75.7 75.2 71.1 82.1 74.3 75.7 10.9 11 80.0 81.5 78.4 73.8 78.1 78.4 7.7 12 80.6 81.8 79.3 73.8 81.7 79.4 8.0 13 82.7 81.3 79.1 82.0 79.5 80.9 3.6 14 79.2 74.9 78.6 77.7 75.3 77.1 4.3 15 85.5 82.1 82.8 73.4 71.7 79.1 13.8 16 78.8 79.6 80.2 79.1 80.8 79.7 2.0 17 82.1 78.2 18 84.5 76.9 75.5 83.5 81.2 19 79.0 77.8 20 84.5 73.1 78.2 82.1 79.2 81.1 7.6 81.2 84.4 81.6 80.8…arrow_forward
- Name: Lab Time: Quiz 7 & 8 (Take Home) - due Wednesday, Feb. 26 Contingency Analysis (Ch. 9) In lab 5, part 3, you will create a mosaic plot and conducted a chi-square contingency test to evaluate whether elderly patients who did not stop walking to talk (vs. those who did stop) were more likely to suffer a fall in the next six months. I have tabulated the data below. Answer the questions below. Please show your calculations on this or a separate sheet. Did not stop walking to talk Stopped walking to talk Totals Suffered a fall Did not suffer a fall Totals 12 11 23 2 35 37 14 14 46 60 Quiz 7: 1. (2 pts) Compute the odds of falling for each group. Compute the odds ratio for those who did not stop walking vs. those who did stop walking. Interpret your result verbally.arrow_forwardSolve please and thank you!arrow_forward7. In a 2011 article, M. Radelet and G. Pierce reported a logistic prediction equation for the death penalty verdicts in North Carolina. Let Y denote whether a subject convicted of murder received the death penalty (1=yes), for the defendant's race h (h1, black; h = 2, white), victim's race i (i = 1, black; i = 2, white), and number of additional factors j (j = 0, 1, 2). For the model logit[P(Y = 1)] = a + ß₁₂ + By + B²², they reported = -5.26, D â BD = 0, BD = 0.17, BY = 0, BY = 0.91, B = 0, B = 2.02, B = 3.98. (a) Estimate the probability of receiving the death penalty for the group most likely to receive it. [4 pts] (b) If, instead, parameters used constraints 3D = BY = 35 = 0, report the esti- mates. [3 pts] h (c) If, instead, parameters used constraints Σ₁ = Σ₁ BY = Σ; B = 0, report the estimates. [3 pts] Hint the probabilities, odds and odds ratios do not change with constraints.arrow_forward
- Solve please and thank you!arrow_forwardSolve please and thank you!arrow_forwardQuestion 1:We want to evaluate the impact on the monetary economy for a company of two types of strategy (competitive strategy, cooperative strategy) adopted by buyers.Competitive strategy: strategy characterized by firm behavior aimed at obtaining concessions from the buyer.Cooperative strategy: a strategy based on a problem-solving negotiating attitude, with a high level of trust and cooperation.A random sample of 17 buyers took part in a negotiation experiment in which 9 buyers adopted the competitive strategy, and the other 8 the cooperative strategy. The savings obtained for each group of buyers are presented in the pdf that i sent: For this problem, we assume that the samples are random and come from two normal populations of unknown but equal variances.According to the theory, the average saving of buyers adopting a competitive strategy will be lower than that of buyers adopting a cooperative strategy.a) Specify the population identifications and the hypotheses H0 and H1…arrow_forward
- You assume that the annual incomes for certain workers are normal with a mean of $28,500 and a standard deviation of $2,400. What’s the chance that a randomly selected employee makes more than $30,000?What’s the chance that 36 randomly selected employees make more than $30,000, on average?arrow_forwardWhat’s the chance that a fair coin comes up heads more than 60 times when you toss it 100 times?arrow_forwardSuppose that you have a normal population of quiz scores with mean 40 and standard deviation 10. Select a random sample of 40. What’s the chance that the mean of the quiz scores won’t exceed 45?Select one individual from the population. What’s the chance that his/her quiz score won’t exceed 45?arrow_forward
arrow_back_ios
SEE MORE QUESTIONS
arrow_forward_ios
Recommended textbooks for you
 Linear Algebra: A Modern IntroductionAlgebraISBN:9781285463247Author:David PoolePublisher:Cengage Learning
 Glencoe Algebra 1, Student Edition, 9780079039897...AlgebraISBN:9780079039897Author:CarterPublisher:McGraw Hill
Linear Algebra: A Modern Introduction
Algebra
ISBN:9781285463247
Author:David Poole
Publisher:Cengage Learning
Glencoe Algebra 1, Student Edition, 9780079039897...
Algebra
ISBN:9780079039897
Author:Carter
Publisher:McGraw Hill
Statistics 4.1 Point Estimators; Author: Dr. Jack L. Jackson II;https://www.youtube.com/watch?v=2MrI0J8XCEE;License: Standard YouTube License, CC-BY
Statistics 101: Point Estimators; Author: Brandon Foltz;https://www.youtube.com/watch?v=4v41z3HwLaM;License: Standard YouTube License, CC-BY
Central limit theorem; Author: 365 Data Science;https://www.youtube.com/watch?v=b5xQmk9veZ4;License: Standard YouTube License, CC-BY
Point Estimate Definition & Example; Author: Prof. Essa;https://www.youtube.com/watch?v=OTVwtvQmSn0;License: Standard Youtube License
Point Estimation; Author: Vamsidhar Ambatipudi;https://www.youtube.com/watch?v=flqhlM2bZWc;License: Standard Youtube License