
Interpretation:
The shape of the labelled atoms in the below structure of enanthotoxin needs to be determined.
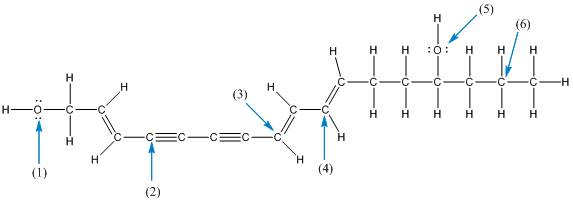
Concept introduction:
Shape of a molecule is determined by including only the bond pair not the lone pairs on the central atom while geometry includes both the bond pairs and lone pairs on the central atom. Valence shell electron pair repulsion theory or VSEPR theory used in chemistry as a model for the prediction of shape of various molecules by knowing the electron pairs on the central atom. There will be repulsion between the electron pairs present on central atom, so to minimize the repulsion they adopt an arrangement with minimum repulsion, thus determining molecule's shape. And by knowing the shape we can easily determine the bond angles.
The following table should be used while determining the shapes:
| Number of groups | Number of lone pairs | Shape | Bond angle | |
| 2 | 2 | 0 | Linear | |
| 3 | 3 | 0 | Trigonal planar | |
| 4 | 4 | 0 | Tetrahedral | |
| 4 | 3 | 1 | Trigonal pyramidal | |
| 4 | 2 | 2 | Bent |
Want to see the full answer?
Check out a sample textbook solution
Chapter 11 Solutions
GENERAL,ORGANIC, & BIOLOGICAL CHEM-ACCES

- The temperature on a sample of pure X held at 1.25 atm and -54. °C is increased until the sample boils. The temperature is then held constant and the pressure is decreased by 0.42 atm. On the phase diagram below draw a path that shows this set of changes. pressure (atm) 2 0 0 200 400 temperature (K) Xarrow_forwardQUESTION: Answer Question 5: 'Calculating standard error of regression' STEP 1 by filling in all the empty green boxes *The values are all provided in the photo attached*arrow_forwardpressure (atm) 3 The pressure on a sample of pure X held at 47. °C and 0.88 atm is increased until the sample condenses. The pressure is then held constant and the temperature is decreased by 82. °C. On the phase diagram below draw a path that shows this set of changes. 0 0 200 temperature (K) 400 аarrow_forward
- er your payment details | bar xb Home | bartleby x + aleksogi/x/isl.exe/1o u-lgNskr7j8P3jH-1Qs_pBanHhviTCeeBZbufuBYT0Hz7m7D3ZcW81NC1d8Kzb4srFik1OUFhKMUXzhGpw7k1 O States of Matter Sketching a described thermodynamic change on a phase diagram 0/5 The pressure on a sample of pure X held at 47. °C and 0.88 atm is increased until the sample condenses. The pressure is then held constant and the temperature is decreased by 82. °C. On the phase diagram below draw a path that shows this set of changes. pressure (atm) 1 3- 0- 0 200 Explanation Check temperature (K) 400 X Q Search L G 2025 McGraw Hill LLC. All Rights Reserved Terms of Use Privacy Cearrow_forward5.arrow_forward6.arrow_forward
- 0/5 alekscgi/x/sl.exe/1o_u-IgNglkr7j8P3jH-IQs_pBaHhvlTCeeBZbufuBYTi0Hz7m7D3ZcSLEFovsXaorzoFtUs | AbtAURtkqzol 1HRAS286, O States of Matter Sketching a described thermodynamic change on a phase diagram The pressure on a sample of pure X held at 47. °C and 0.88 atm is increased until the sample condenses. The pressure is then held constant and the temperature is decreased by 82. °C. On the phase diagram below draw a path that shows this set of changes. 3 pressure (atm) + 0- 0 5+ 200 temperature (K) 400 Explanation Check X 0+ F3 F4 F5 F6 F7 S 2025 McGraw Hill LLC All Rights Reserved. Terms of Use Privacy Center Accessibility Q Search LUCR + F8 F9 F10 F11 F12 * % & ( 5 6 7 8 9 Y'S Dele Insert PrtSc + Backsarrow_forward5.arrow_forward9arrow_forward
- alekscgi/x/lsl.exe/1o_u-IgNslkr7j8P3jH-IQs_pBanHhvlTCeeBZbufu BYTI0Hz7m7D3ZS18w-nDB10538ZsAtmorZoFusYj2Xu9b78gZo- O States of Matter Sketching a described thermodynamic change on a phase diagram 0/5 The pressure on a sample of pure X held at 47. °C and 0.88 atm is increased until the sample condenses. The pressure is then held constant and the temperature is decreased by 82. °C. On the phase diagram below draw a path that shows this set of changes. pressure (atm) 3- 200 temperature (K) Explanation Chick Q Sowncharrow_forward0+ aleksog/x/lsl.exe/1ou-lgNgkr7j8P3H-IQs pBaHhviTCeeBZbufuBYTOHz7m7D3ZStEPTBSB3u9bsp3Da pl19qomOXLhvWbH9wmXW5zm O States of Matter Sketching a described thermodynamic change on a phase diagram 0/5 Gab The temperature on a sample of pure X held at 0.75 atm and -229. °C is increased until the sample sublimes. The temperature is then held constant and the pressure is decreased by 0.50 atm. On the phase diagram below draw a path that shows this set of changes. F3 pressure (atm) 0- 0 200 Explanation temperature (K) Check F4 F5 ☀+ Q Search Chill Will an 9 ENG F6 F7 F8 F9 8 Delete F10 F11 F12 Insert PrtSc 114 d Ararrow_forwardx + LEKS: Using a phase diagram a X n/alekscgi/x/lsl.exe/10_u-IgNsikr7j8P3jH-IQs_pBan HhvlTCeeBZbufu BYTI0Hz7m7D3ZcHYUt80XL-5alyVpw ○ States of Matter Using a phase diagram to find a phase transition temperature or pressure Use the phase diagram of Substance X below to find the melting point of X when the pressure above the solid is 1.1 atm. pressure (atm) 16 08- solid liquid- 0 200 400 gas 600 temperature (K) Note: your answer must be within 25 °C of the exact answer to be graded correct. × 5arrow_forward
 ChemistryChemistryISBN:9781305957404Author:Steven S. Zumdahl, Susan A. Zumdahl, Donald J. DeCostePublisher:Cengage Learning
 ChemistryChemistryISBN:9781259911156Author:Raymond Chang Dr., Jason Overby ProfessorPublisher:McGraw-Hill Education
 Principles of Instrumental AnalysisChemistryISBN:9781305577213Author:Douglas A. Skoog, F. James Holler, Stanley R. CrouchPublisher:Cengage Learning
 Organic ChemistryChemistryISBN:9780078021558Author:Janice Gorzynski Smith Dr.Publisher:McGraw-Hill Education
 Chemistry: Principles and ReactionsChemistryISBN:9781305079373Author:William L. Masterton, Cecile N. HurleyPublisher:Cengage Learning
 Elementary Principles of Chemical Processes, Bind...ChemistryISBN:9781118431221Author:Richard M. Felder, Ronald W. Rousseau, Lisa G. BullardPublisher:WILEY