
Concept explainers
a.
To find: The
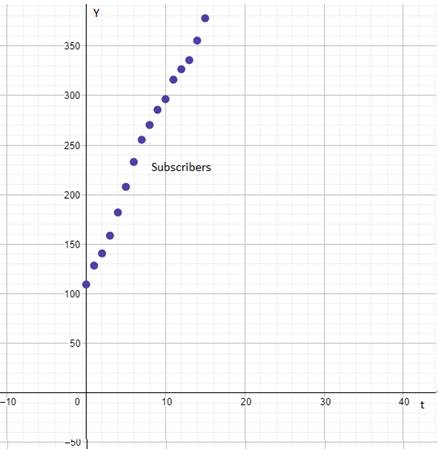
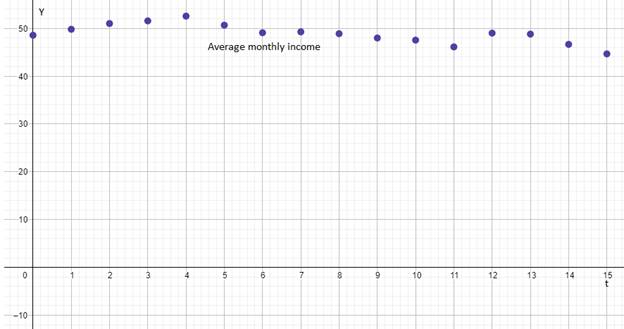
The scatter plot of the data is shown below.
Given:
The data of subscriber and number of revenue per person is shown below.
| Year | No of subscribers | Average revenue per subscriber |
| 2000 | 109.5 | 48.55 |
| 2001 | 128.4 | 49.79 |
| 2002 | 140.8 | 51 |
| 2003 | 158.7 | 51.55 |
| 2004 | 182.1 | 52.54 |
| 2005 | 207.9 | 50.65 |
| 2006 | 233 | 49.07 |
| 2007 | 255.4 | 49.26 |
| 2008 | 270.3 | 48.87 |
| 2009 | 285.6 | 47.97 |
| 2010 | 296.3 | 47.53 |
| 2011 | 316 | 46.11 |
| 2012 | 326.5 | 48.99 |
| 2013 | 335.7 | 48.79 |
| 2014 | 355.4 | 46.64 |
| 2015 | 377.9 | 44.65 |
Calculation:
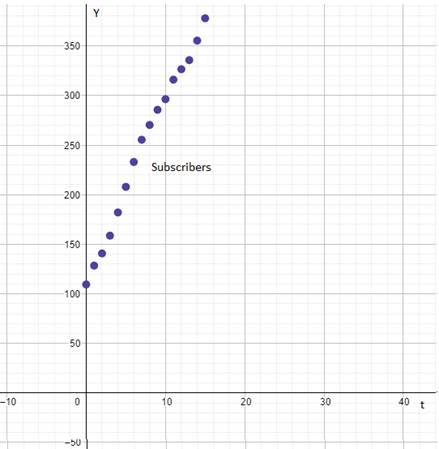
The scatter plot of the data of subscribers’ verses time is shown below.
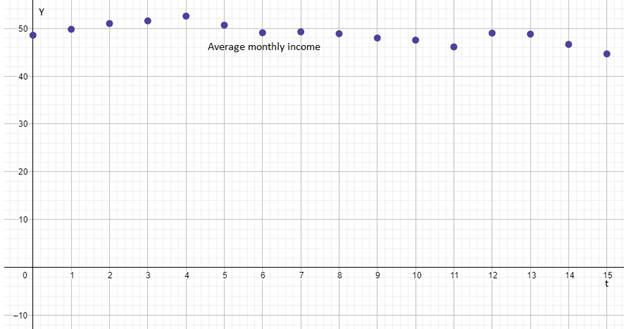
The scatter plot of the data of average monthly income verses time is shown below.
b.
To find: The slope intercept form of line for one of the scatter plots which is linear.
The slope intercept form of line is
Given:
The data of subscriber and number of revenue per person is shown below.
| Year | No of subscribers | Average revenue per subscriber |
| 2000 | 109.5 | 48.55 |
| 2001 | 128.4 | 49.79 |
| 2002 | 140.8 | 51 |
| 2003 | 158.7 | 51.55 |
| 2004 | 182.1 | 52.54 |
| 2005 | 207.9 | 50.65 |
| 2006 | 233 | 49.07 |
| 2007 | 255.4 | 49.26 |
| 2008 | 270.3 | 48.87 |
| 2009 | 285.6 | 47.97 |
| 2010 | 296.3 | 47.53 |
| 2011 | 316 | 46.11 |
| 2012 | 326.5 | 48.99 |
| 2013 | 335.7 | 48.79 |
| 2014 | 355.4 | 46.64 |
| 2015 | 377.9 | 44.65 |
The
Formula used:
Calculation:
From the graphs of subscribers verses time and average monthly revenue per subscriber verses time the graph of subscribers verses time is linear.
Calculation of slope intercepts form of line for number of subscribers.
Taking
Substitute the values in the formula
Substitute the value of
Substitute the values of
c.
To find: The best fit line and scatter plot on the same graph.
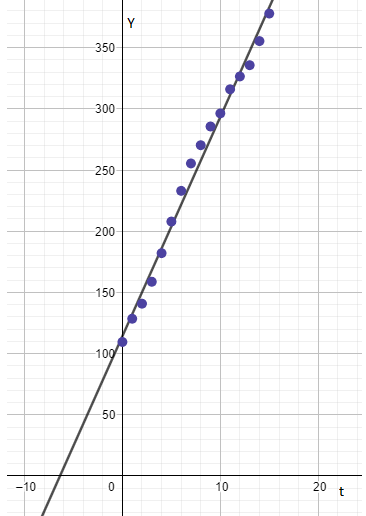
The graph representing the scatter plot and the best fit line is shown below.
Given:
The data of subscriber and number of revenue per person is shown below.
| Year | No of subscribers | Average revenue per subscriber |
| 2000 | 109.5 | 48.55 |
| 2001 | 128.4 | 49.79 |
| 2002 | 140.8 | 51 |
| 2003 | 158.7 | 51.55 |
| 2004 | 182.1 | 52.54 |
| 2005 | 207.9 | 50.65 |
| 2006 | 233 | 49.07 |
| 2007 | 255.4 | 49.26 |
| 2008 | 270.3 | 48.87 |
| 2009 | 285.6 | 47.97 |
| 2010 | 296.3 | 47.53 |
| 2011 | 316 | 46.11 |
| 2012 | 326.5 | 48.99 |
| 2013 | 335.7 | 48.79 |
| 2014 | 355.4 | 46.64 |
| 2015 | 377.9 | 44.65 |
Observation:
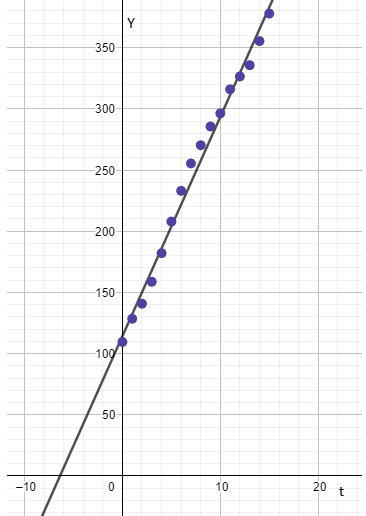
The graph of subscriber verses time and average monthly revenue per subscriber verses time the best fit line fits appropriately to the graph of subscribers verses time.
d.
To find: The pattern that the graph of subscribers verses time with best fit line follow.
Some points are left after the best fit has been drawn with the help of scatter points.
Given:
The data of subscriber and number of revenue per person is shown below.
| Year | No of subscribers | Average revenue per subscriber |
| 2000 | 109.5 | 48.55 |
| 2001 | 128.4 | 49.79 |
| 2002 | 140.8 | 51 |
| 2003 | 158.7 | 51.55 |
| 2004 | 182.1 | 52.54 |
| 2005 | 207.9 | 50.65 |
| 2006 | 233 | 49.07 |
| 2007 | 255.4 | 49.26 |
| 2008 | 270.3 | 48.87 |
| 2009 | 285.6 | 47.97 |
| 2010 | 296.3 | 47.53 |
| 2011 | 316 | 46.11 |
| 2012 | 326.5 | 48.99 |
| 2013 | 335.7 | 48.79 |
| 2014 | 355.4 | 46.64 |
| 2015 | 377.9 | 44.65 |
Observation:
The graph of subscriber verses time with best fit line is shown below.
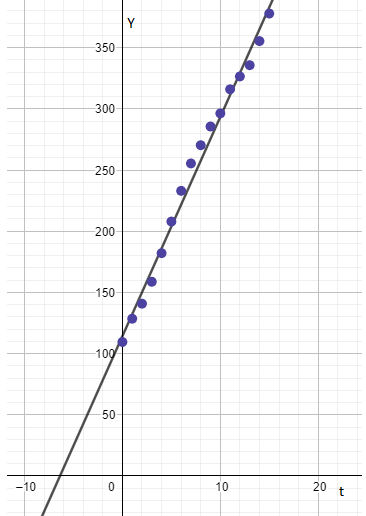
From the graph it is clear that some points are left out after drawing the best fit line with the help of scatter plot points.
e.
To find: The trend that the average monthly revenue per subscriber follows from
The decreasing and increasing pattern of revenue tells that the market the price will rose and fall according to the demand and supply.
Given:
The data of subscriber and number of revenue per person is shown below.
| Year | No of subscribers | Average revenue per subscriber |
| 2000 | 109.5 | 48.55 |
| 2001 | 128.4 | 49.79 |
| 2002 | 140.8 | 51 |
| 2003 | 158.7 | 51.55 |
| 2004 | 182.1 | 52.54 |
| 2005 | 207.9 | 50.65 |
| 2006 | 233 | 49.07 |
| 2007 | 255.4 | 49.26 |
| 2008 | 270.3 | 48.87 |
| 2009 | 285.6 | 47.97 |
| 2010 | 296.3 | 47.53 |
| 2011 | 316 | 46.11 |
| 2012 | 326.5 | 48.99 |
| 2013 | 335.7 | 48.79 |
| 2014 | 355.4 | 46.64 |
| 2015 | 377.9 | 44.65 |
Observation:
From the table it is clearly visible that the average monthly revenue per subscriber follows a pattern that is decreasing and after
Chapter 1 Solutions
PRECALCULUS:GRAPH...-NASTA ED.(FLORIDA)
- Calculus III May I please have the example, definition semicolons, and all blanks completed and solved? Thank you so much,arrow_forwardA company estimates that the revenue (in dollars) from the sale of x doghouses is given by R(x) = 12,000 In (0.02x+1). Use the differential to approximate the change in revenue from the sale of one more doghouse if 80 doghouses have already been sold. The revenue will increase by $ if one more doghouse is made. (Round to the nearest cent as needed.)arrow_forwardThe population of bacteria (in millions) in a certain culture x hours after an experimental 20x nutrient is introduced into the culture is P(x) = - 2 Use the differential to approximate the changes in population for the following changes in x. 8+x a. 1 to 1.5 b. 3 to 3.25 a. Use the differential to approximate the change in population for x=1 to 1.5. Between 1 and 1.5 hours, the population of bacteria changes by million. (Round to three decimal places as needed.)arrow_forward
- The demand for grass seed (in thousands of pounds) at price p dollars is given by the following function. D(p) 3p³-2p² + 1460 Use the differential to approximate the changes in demand for the following changes in p. a. $4 to $4.11 b. $6 to $6.19arrow_forwardLet the region R be the area enclosed by the function f(x) = 3 ln (x) and g(x) = 3 x + 1. Write an integral in terms of x and also an integral in terms of y that would represent the area of the region R. If necessary, round limit values to the nearest thousandth. Answer Attempt 1 out of 2 y 7 10 6 5 4 3 2 -1 2 3 4 5 6 x2 dx x1 = x2 = x1 Y1 = Y2 = Y1 dyarrow_forwardA manufacturer of handcrafted wine racks has determined that the cost to produce x units per month is given by C = 0.3x² + 7,000. How fast is the cost per month changing when production is changing at the rate of 14 units per month and the production level is 80 units? Costs are increasing at the rate of $ (Round to the nearest dollar as needed.) per month at this production level.arrow_forward
- dy Assume x and y are functions of t. Evaluate for 2xy -3x+2y³ = - 72, with the conditions dt dx dt = -8, x=2, y = -3. dy dt (Type an exact answer in simplified form.)arrow_forwardConsider the sequence below: 1 1 1 (a) Express this sequence as a recurrence relation (b) Express this sequence in the form {a}=1 (c) Does this sequence converge or diverge? Justify your answer. Consider the sequence below: 1 1 1 1, 4' 9' 16' (a) Express this sequence in the form {ak}=1 (b) Does this sequence converge or diverge? Justify your answer. Consider the sequence below: 345 2. 4' 9' 16' ·} (a) Express this sequence in the form {a}1 (b) Does this sequence converge or diverge? Justify your answer.arrow_forwardUse the growth rate of sequences theorem to find the limit or state it divergesarrow_forward
- calculate the maximum value of the directional derivativearrow_forward2. A tank with a capacity of 650 gal. originally contains 200 gal of water with 100 lb. of salt in solution. Water containing 1 lb. of salt per gallon is entering at a rate of 4 gal/min, and the mixture is allowed to flow out of the tank at a rate of 3 gal/min. a. Find the amount of salt in the tank at any time prior to the instant when the tank begins to overflow (650 gallons). b. Find the concentration (in pounds per gallon) of salt in the tank when the tank hits 400 gallons. D.E. for mixture problems: dv dt=11-12 dA A(t) dtarrow_forward- Suppose that you have the differential equation: dy = (y - 2) (y+3) dx a. What are the equilibrium solutions for the differential equation? b. Where is the differential equation increasing or decreasing? Show how you know. Showing them on the drawing is not enough. c. Where are the changes in concavity for the differential equation? Show how you know. Showing them on the drawing is not enough. d. Consider the slope field for the differential equation. Draw solution curves given the following initial conditions: i. y(0) = -5 ii. y(0) = -1 iii. y(0) = 2arrow_forward
 Calculus: Early TranscendentalsCalculusISBN:9781285741550Author:James StewartPublisher:Cengage Learning
 Thomas' Calculus (14th Edition)CalculusISBN:9780134438986Author:Joel R. Hass, Christopher E. Heil, Maurice D. WeirPublisher:PEARSON
 Calculus: Early Transcendentals (3rd Edition)CalculusISBN:9780134763644Author:William L. Briggs, Lyle Cochran, Bernard Gillett, Eric SchulzPublisher:PEARSON
 Calculus: Early TranscendentalsCalculusISBN:9781319050740Author:Jon Rogawski, Colin Adams, Robert FranzosaPublisher:W. H. Freeman
 Calculus: Early Transcendental FunctionsCalculusISBN:9781337552516Author:Ron Larson, Bruce H. EdwardsPublisher:Cengage Learning


