Concept explainers
a.
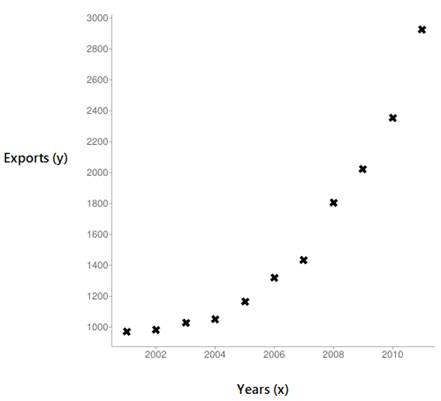
To Sketch: The
Given:
The average U.S. exports of the product for the years
| Year | Exports |
Graph:
Let
Use the instruction to generate a scatter diagram for a set of data:
Press the data column and
And Press the
To clear the graph and enter a new data set, press
The scatter plot for the given data with years in

b.
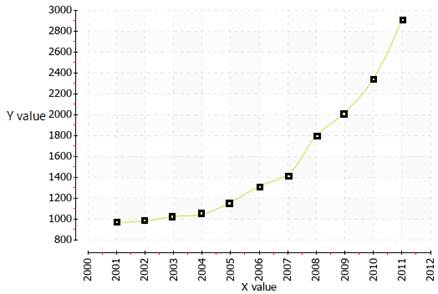
To Model: Superimpose the parabolic curve on the scatter plot using quadratic regression with a quadratic function. Analyse whether it is good fit or not.
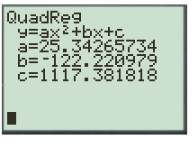
The quadratic function is
Given:
The average U.S. exports of the product for the years
| Year | Exports |
Calculation:
Compute the Quadratic regression equation for the provided data using Ti-83 calculator as follow:
Press
Press
The screenshot is as follows:

Thus, the quadratic function is
Superimpose the parabolic curve on the scatter plot:
Enter the model

Thus, the fit is very good since the graph usually passes through the points.
c.
To Determine: The number thousands of barrels of oil the country will export per day in
Approximately
Given:
The average U.S. exports of the product for the years
| Year | Exports |
Calculation:
Let, the number of years be
To find the number of gallons of oil will be produced per day in
So, subtract the initial year
Now, substitute
Round to the approximate values:
Thus, approximately
Chapter 1 Solutions
PRECALCULUS:GRAPH...-NASTA ED.(FLORIDA)
- question 10 pleasearrow_forward00 (a) Starting with the geometric series Σ X^, find the sum of the series n = 0 00 Σηχη - 1, |x| < 1. n = 1 (b) Find the sum of each of the following series. 00 Σnx", n = 1 |x| < 1 (ii) n = 1 sin (c) Find the sum of each of the following series. (i) 00 Σn(n-1)x^, |x| <1 n = 2 (ii) 00 n = 2 n² - n 4n (iii) M8 n = 1 շոarrow_forward(a) Use differentiation to find a power series representation for 1 f(x) = (4 + x)²* f(x) = 00 Σ n = 0 What is the radius of convergence, R? R = (b) Use part (a) to find a power series for f(x) = 1 (4 + x)³° f(x) = 00 Σ n = 0 What is the radius of convergence, R? R = (c) Use part (b) to find a power series for f(x) = x² (4 + x)³* 00 f(x) = Σ n = 2 What is the radius of convergence, R? R = Need Help? Read It Watch It SUBMIT ANSWERarrow_forward
- answer for question 4 pleasearrow_forward(3) (20 points) Let F(x, y, z) = (y, z, x²z). Define E = {(x, y, z) | x² + y² ≤ z ≤ 1, x ≤ 0}. (a) (2 points) Calculate the divergence V. F. (b) (4 points) Let D = {(x, y) | x² + y² ≤ 1, x ≤ 0} Without calculation, show that the triple integral √ (V · F) dV = √ 2²(1. = x²(1 − x² - y²) dA. Earrow_forward(2) (22 points) Let F(x, y, z) = (x sin y, cos y, ―xy). (a) (2 points) Calculate V. F. (b) (6 points) Given a vector field is everywhere defined with V G₁(x, y, z) = * G2(x, y, z) = − G3(x, y, z) = 0. 0 0 F(x, y, z) = (F₁(x, y, z), F₂(x, y, z), F(x, y, z)) that F = 0, let G = (G1, G2, G3) where F₂(x, y, y, t) dt - √ F³(x, t, 0) dt, * F1(x, y, t) dt, t) dt - √ F Calculate G for the vector field F(x, y, z) = (x sin y, cos y, -xy).arrow_forward
- Evaluate the following integral over the Region R. (Answer accurate to 2 decimal places). √ √(x + y) A R R = {(x, y) | 25 < x² + y² ≤ 36, x < 0} Hint: The integral and Region is defined in rectangular coordinates.arrow_forwardFind the volume of the solid that lies under the paraboloid z = 81 - x² - y² and within the cylinder (x − 1)² + y² = 1. A plot of an example of a similar solid is shown below. (Answer accurate to 2 decimal places). Volume using Double Integral Paraboloid & Cylinder -3 Hint: The integral and region is defined in polar coordinates.arrow_forwardEvaluate the following integral over the Region R. (Answer accurate to 2 decimal places). √4(1–2² 4(1 - x² - y²) dA R 3 R = {(r,0) | 0 ≤ r≤ 2,0π ≤0≤¼˜}. Hint: The integral is defined in rectangular coordinates. The Region is defined in polar coordinates.arrow_forward
- Evaluate the following integral over the Region R. (Answer accurate to 2 decimal places). R - 1 · {(r,0) | 1 ≤ r≤ 5,½π≤ 0<1π}. Hint: Be sure to convert to Polar coordinates. Use the correct differential for Polar Coordinates.arrow_forwardEvaluate the following integral over the Region R. (Answer accurate to 2 decimal places). √ √2(x+y) dA R R = {(x, y) | 4 < x² + y² < 25,0 < x} Hint: The integral and Region is defined in rectangular coordinates.arrow_forwardHW: The frame shown in the figure is pinned at A and C. Use moment distribution method, with and without modifications, to draw NFD, SFD, and BMD. B I I 40 kN/m A 3 m 4 marrow_forward
 Calculus: Early TranscendentalsCalculusISBN:9781285741550Author:James StewartPublisher:Cengage Learning
 Thomas' Calculus (14th Edition)CalculusISBN:9780134438986Author:Joel R. Hass, Christopher E. Heil, Maurice D. WeirPublisher:PEARSON
 Calculus: Early Transcendentals (3rd Edition)CalculusISBN:9780134763644Author:William L. Briggs, Lyle Cochran, Bernard Gillett, Eric SchulzPublisher:PEARSON
 Calculus: Early TranscendentalsCalculusISBN:9781319050740Author:Jon Rogawski, Colin Adams, Robert FranzosaPublisher:W. H. Freeman
 Calculus: Early Transcendental FunctionsCalculusISBN:9781337552516Author:Ron Larson, Bruce H. EdwardsPublisher:Cengage Learning


