
Concept explainers
a)
To determine: The mean of each sample.
a)
Answer to Problem 20P
Explanation of Solution
Given information:
| Sample | |||
| 1 | 2 | 3 | 4 |
| 4.5 | 4.6 | 4.5 | 4.7 |
| 4.2 | 4.5 | 4.6 | 4.6 |
| 4.2 | 4.4 | 4.4 | 4.8 |
| 4.3 | 4.7 | 4.4 | 4.5 |
| 4.3 | 4.3 | 4.6 | 4.9 |
Calculation of mean of each sample:
| Sample | ||||
| Sl. No. | 1 | 2 | 3 | 4 |
| 1 | 4.5 | 4.6 | 4.5 | 4.7 |
| 2 | 4.2 | 4.5 | 4.6 | 4.6 |
| 3 | 4.2 | 4.4 | 4.4 | 4.8 |
| 4 | 4.3 | 4.7 | 4.4 | 4.5 |
| 5 | 4.3 | 4.3 | 4.6 | 4.9 |
| Mean | 4.3 | 4.5 | 4.5 | 4.7 |
Table 1
Excel Worksheet:
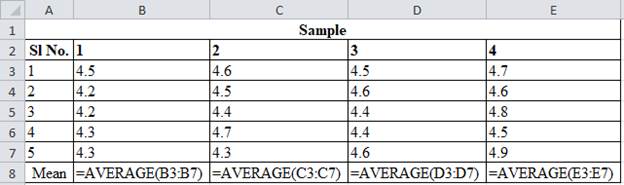
Sample 1:
The mean is calculated by adding each sample points. Adding the points 4.5, 4.2, 4.2, 4.3 and 4.3 and dividing by 5 gives mean of 4.3. The same process is followed for finding mean for other samples.
Hence, the mean of each sample is shown in Table 1
b)
To determine: The mean and standard deviation when the process parameters are unknown.
b)
Answer to Problem 20P
Explanation of Solution
Given information:
| Sample | |||
| 1 | 2 | 3 | 4 |
| 4.5 | 4.6 | 4.5 | 4.7 |
| 4.2 | 4.5 | 4.6 | 4.6 |
| 4.2 | 4.4 | 4.4 | 4.8 |
| 4.3 | 4.7 | 4.4 | 4.5 |
| 4.3 | 4.3 | 4.6 | 4.9 |
Calculation of mean and standard deviation:
Table 1 provides the mean for each sample points.
The mean is calculated by adding each mean of the samples. Adding the points 4.3, 4.5, 4.5 and 4.7 and dividing by 4 gives mean of 4.5.
The standard deviation is calculated using the above formula and substituting the values of mean in the above formula and the resultant of 0.192 is obtained.
Hence, the mean and standard deviation when the process parameters are unknown are 4.5 and 0.192.
c)
To determine: The mean and standard deviation of the sampling distribution.
c)
Answer to Problem 20P
Explanation of Solution
Given information:
| Sample | |||
| 1 | 2 | 3 | 4 |
| 4.5 | 4.6 | 4.5 | 4.7 |
| 4.2 | 4.5 | 4.6 | 4.6 |
| 4.2 | 4.4 | 4.4 | 4.8 |
| 4.3 | 4.7 | 4.4 | 4.5 |
| 4.3 | 4.3 | 4.6 | 4.9 |
Calculation of mean and standard deviation of the sampling distribution:
From calculation of mean of each samples, the mean for sampling distribution can be computed, the mean for sampling distribution is 4.5 (refer equation (1)).
The standard deviation of the sampling distribution is calculated by dividing 0.192 with the square root of 5 which gives the resultant as 0.086.
Hence, the mean and standard deviation of the sampling distribution is 4.5 and 0.086 respectively.
d)
To determine: The three-sigma control limit for the process and alpha risk provided by them.
d)
Answer to Problem 20P
Explanation of Solution
Given information:
| Sample | |||
| 1 | 2 | 3 | 4 |
| 4.5 | 4.6 | 4.5 | 4.7 |
| 4.2 | 4.5 | 4.6 | 4.6 |
| 4.2 | 4.4 | 4.4 | 4.8 |
| 4.3 | 4.7 | 4.4 | 4.5 |
| 4.3 | 4.3 | 4.6 | 4.9 |
Calculation of three-sigma control limit for the process:
The three-sigma control limits for the process is calculated by multiplying 3.00 with 0.086 (refer equation (2)) and the resultant is added with 4.5 to get an upper control limit which is 4.758 and subtracted to get lower control limit which is 4.242. Using z-factor table z = +3.00 corresponds to 0.4987.
The alpha risk is calculated to be as 0.0026.
Hence, the three-sigma control limits for the process are 4.758 and 4.242.
e)
To determine: The alpha risk for control limits of 4.14 and 4.86.
e)
Answer to Problem 20P
Explanation of Solution
Given information:
| Sample | |||
| 1 | 2 | 3 | 4 |
| 4.5 | 4.6 | 4.5 | 4.7 |
| 4.2 | 4.5 | 4.6 | 4.6 |
| 4.2 | 4.4 | 4.4 | 4.8 |
| 4.3 | 4.7 | 4.4 | 4.5 |
| 4.3 | 4.3 | 4.6 | 4.9 |
Formula:
Calculation alpha risk for control limits of 4.14 and 4.86:
The alpha risk is calculated by dividing the difference of 4.86 and 4.5 with 0.086 which gives +4.19 which is the risk is close to zero.
Hence, the alpha risk for control limits of 4.14 and 4.86 is +4.1
f)
To determine: Whether any of the sample means are beyond the control limits.
f)
Answer to Problem 20P
Explanation of Solution
Given information:
| Sample | |||
| 1 | 2 | 3 | 4 |
| 4.5 | 4.6 | 4.5 | 4.7 |
| 4.2 | 4.5 | 4.6 | 4.6 |
| 4.2 | 4.4 | 4.4 | 4.8 |
| 4.3 | 4.7 | 4.4 | 4.5 |
| 4.3 | 4.3 | 4.6 | 4.9 |
Determination of whether any of the sample means are beyond the control limits:
Table 1 provides the sample means for each sample. From observation, it can be found that each sample mean are within the control limit of 4.14 and 4.86. Therefore, each sample means lies within the control limits of 4.14 and 4.86.
Hence, there are no sample means which lies beyond the control limits.
g)
To determine: Whether any of the samples are beyond the control limits.
g)
Answer to Problem 20P
Explanation of Solution
Given information:
| SAMPLE | |||
| 1 | 2 | 3 | 4 |
| 4.5 | 4.6 | 4.5 | 4.7 |
| 4.2 | 4.5 | 4.6 | 4.6 |
| 4.2 | 4.4 | 4.4 | 4.8 |
| 4.3 | 4.7 | 4.4 | 4.5 |
| 4.3 | 4.3 | 4.6 | 4.9 |
Formula:
Mean Chart:
Range Chart:
Calculation of upper and lower control limits:
| SAMPLE | ||||
| 1 | 2 | 3 | 4 | |
| 4.5 | 4.6 | 4.5 | 4.7 | |
| 4.2 | 4.5 | 4.6 | 4.6 | |
| 4.2 | 4.4 | 4.4 | 4.8 | |
| 4.3 | 4.7 | 4.4 | 4.5 | |
| 4.3 | 4.3 | 4.6 | 4.9 | |
| Mean | 4.3 | 4.5 | 4.5 | 4.7 |
| Range | .3 | .4 | .2 | .4 |
From factors of three-sigma chart, A2 = 0.58; D3 = 0; D4 = 2.11.
Mean control chart:
Upper control limit:
The Upper control limit is calculated by adding the product of 0.58 and 0.325 with 4.5 which yields 4.689.
Lower control limit:
The Lower control limit is calculated by subtracting the product of 0.58 and 0.325 with 4.5 which yields 4.311.
The UCL and LCL for mean charts are 4.686 and 4.311. (4)
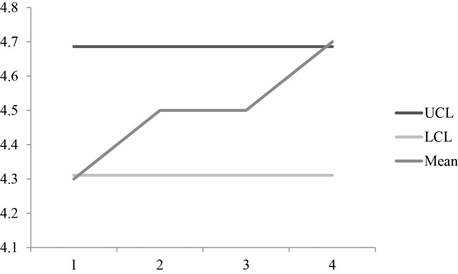
A graph is plotted using the UCL and LCL and mean values which shows the points are within the control limits.
Range control chart:
Upper control limit:
The Upper control limit is calculated by multiplying 2.11 with 0.325 which yields 0.686.
Lower control limit:
The lower control limit is calculated by multiplying 0 with 0.325 which yields 0.0.
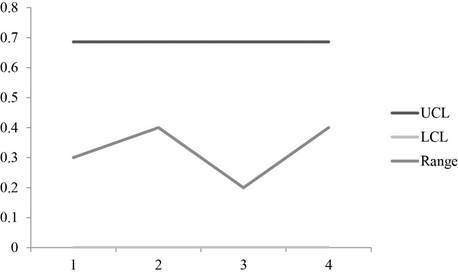
A graph is plotted using the UCL, LCL and Range values which shows that the points are within the control region.
Hence, all points are within control limits.
h)
To explain: The reason for variations in control limits.
h)
Answer to Problem 20P
Explanation of Solution
Reason for variations in control limits:
The control limits vary because in equation (3) and (4) because of the use of different measure for dispersion to measure the standard deviation and range.
Hence, the difference arises due to the use of different measures for dispersion to the measure the standard deviation and range.
i)
To determine: The control limits for the process and whether the process will be in control.
i)
Answer to Problem 20P
Explanation of Solution
Given information:
Determination of control limits of the process:
Sample mean is given in Table 1.
To calculate the control limits 0.18 is divided by root of 5 and is multiplied by 3 and the resultant is added to 4.4 to give UCL which is 4.641 and subtracted from 4.4 to get the LCL which is 4.159.
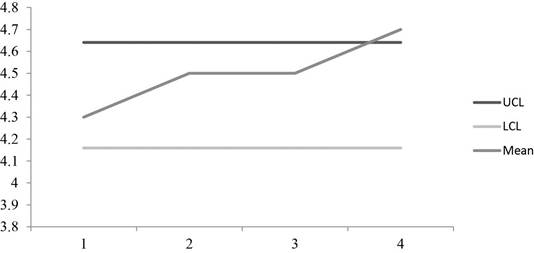
The graph shows that the some of the points are above the control limits which make the process to be out of control.
Hence, the process is out of control with UCL=4.641 and LCL=4.159.
Want to see more full solutions like this?
Chapter 10 Solutions
Operations Management


- Women who ask for what they want in negotiation are less well-liked than women who do not self-advocate. However, nonassertive, other-advocating women suffer a leadership backlash and are regarded as less competent because their behavior is regarded to be _____ and _____. A. high-negative feminine; low-positive masculine B. high-positive feminine; high-positive masculine C. high-negative masculine; low-negative feminine D. low-positive masculine; low-positive femininearrow_forwardThere are five most recognized personality traits that can reliably be measured and predict negotiator behavior in a number of different situations. All of the following are one of those "Big 5" personality traits except _____. A. conscientiousness B. introversion C. agreeableness D. openness to experiencearrow_forwardWith regard to reputation in negotiation, negotiators who use adversarial, stubborn, and ethically questionable behavior often have the effect of _____. A. improving their business relationships B. decreasing their effectiveness as a negotiator C. improving their business relationships D. decreasing their group statusarrow_forward
- When it comes to assertiveness, there is only a modest link between negotiators' self-views and how the counterparty sees them. Many negotiators come away from a negotiation thinking they came on too strong with the counterparty. The _____ refers to the fact that negotiators believe they are coming on too strong with the counterparty, but they actually are not. A. Collective trap illusion B. Attribution error C. Aggressive anchoring bias D. Line-crossing illusionarrow_forwardAs you think about the issue of using chatbots in contract negotiations, consider whether other facets and concepts of negotiations that we have discussed and whether they would be adequately addressed.arrow_forwardWhile I am not a fan of AI as of yet, I do understand the endless possibilities. Based on the research, it is clear that AI has great potential for negotiation (Yang, 2025). Herold et al. (2025) suggested that AI can flag potential risks and liabilities, allowing negotiators to address them and mitigate potential problems proactively. AI can draft new contract templates by examining industry standards and past contracts, and AI technology can help lawyers spot errors and inconsistencies in contract drafts. In relation to risk management, AI can flag possible risks and liabilities, allowing negotiators to proactively address them and lessen potential problems, which can speed up the negotiation process, making the negotiation efficient because AI can industrialize tasks like document review, redlining, and finding potential issues, significantly reducing negotiation time. Lastly, AI can analyze vast amounts of data and identify errors, inconsistencies, and irregularities in…arrow_forward
- What is a main thought on using AI in contract negotiations?arrow_forwardWhat are some people thoughts on using AI in contract negotiations?arrow_forward3. Develop a high-level or summary: a. Risk Management Plan Focus on specific, actionable steps for each risk and mitigation strategy.Provide detailed timelines for procurement, stakeholder engagement, and risk monitoring.Avoid over-simplifying and add more technical details in areas like quality assurance and financial control measures. Add a risk prioritization method and mention how risks will be monitored and reviewed throughout the project lifecycle. Overall, it is well organized andc overs key risks.arrow_forward
- 3. Develop a high-level or summary: Human Resource Management Plan Provide more concrete timelines and actionable steps for human resource management.Include more detailed risk management strategies and link them more explicitly to the overall project plan.Expand on how training and development will be evaluated and tracked.Also, the overall length is good, but some sections could be condensed by eliminating repetition (e.g., you discuss stakeholder communication and engagement in two sections without adding new information).Try not to repeat the same risk management ideas (e.g., resource sharing and stakeholder concerns) in multiple sections without adding value.arrow_forwardBased on the U.S. Department of Transporation's publication on the number of inrternatioal passengers that come through New York airport (JFK) in 2012, how would I estimate the passenger volume for the coming year?arrow_forwardWhat are the role of trends and seasonality based on the Department of Transportation publication of the number of international passengers that come through New York (JFK) in 2012?arrow_forward
 Practical Management ScienceOperations ManagementISBN:9781337406659Author:WINSTON, Wayne L.Publisher:Cengage,