
(a)
Interpretation:
The liquidus temperature for
Concept Introduction:
On the temperature-composition graph of a ceramic, the curve above which the ceramic exist in the liquid phase is the liquidus curve. The temperature at this curve is maximum known as liquidus temperature at which the crystals in the ceramic can coexist with its melt in the
Answer to Problem 10.73P
Liquidus temperature,
Explanation of Solution
The equilibrium phase diagram for the MgO-FeO system is shown below as:

A straight line from
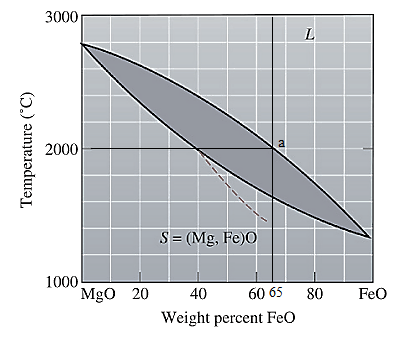
Liquidus temperature
(b)
Interpretation:
The solidus temperature for
Concept Introduction:
Solidus curve is the locus of the temperature on the temperature composition graph of a ceramic, beyond which the ceramic is completely in solid phase. The temperature at this curve is minimum known as solidus temperature at which the crystals in the ceramic can coexist with its melt in the thermodynamic equilibrium.
Answer to Problem 10.73P
Solidus temperature,
Explanation of Solution
The equilibrium phase diagram for the MgO-FeO system is shown below as:

A straight line from
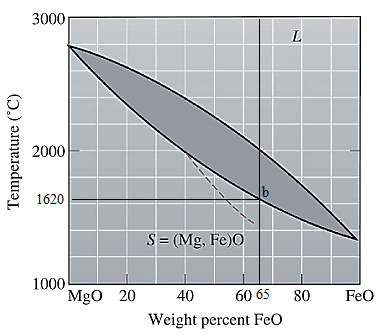
Solidus temperature
(c)
Interpretation:
The freezing range for
Concept Introduction:
Freezing range for a ceramic is the difference of the liquidus and the solidus temperature of a ceramic. In this range, the ceramic melt starts to crystallize at liquidus temperature and solidifies when reaches solidus temperature.
Answer to Problem 10.73P
Freezing range,
Explanation of Solution
From part (a) and (b), the liquidus and solidus temperature for the given ceramic is determined as:
The freezing range (FR) for this ceramic composition will be:
(d)
Interpretation:
The composition of the first solid that is formed when
Concept Introduction:
On the temperature-composition graph of a ceramic, the curve above which the ceramic exist in the liquid phase is the liquidus curve. The temperature at this curve is maximum known as liquidus temperature at which the crystals in the ceramic can coexist with its melt in the thermodynamic equilibrium.
Answer to Problem 10.73P
The composition of the first solid formed is
Explanation of Solution
The equilibrium phase diagram for the MgO-FeO system is shown below as:

A straight line from
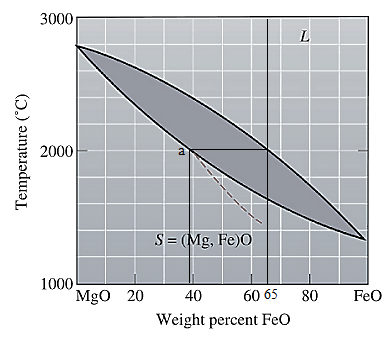
Point 'a' represents the composition of the first solid which is formed when
(e)
Interpretation:
The composition of the last liquid which is solidified when
Concept Introduction:
On the temperature-composition graph of a ceramic, the curve above which the ceramic exist in the liquid phase is the liquidus curve. The temperature at this curve is maximum known as liquidus temperature at which the crystals in the ceramic can coexist with its melt in the thermodynamic equilibrium.
Solidus curve is the locus of the temperature on the temperature composition graph of a ceramic, beyond which the ceramic is completely in solid phase.
Between the solidus and liquidus curve, the ceramic exits in a slurry form in which there is both crystals as well as ceramic melt.
Solidus temperature is always less than or equal to the liquidus temperature.
Answer to Problem 10.73P
The composition of the last liquid solidified is
Explanation of Solution
The equilibrium phase diagram for the MgO-FeO system is shown below as:
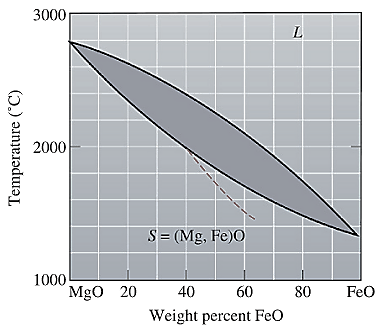
A straight line from
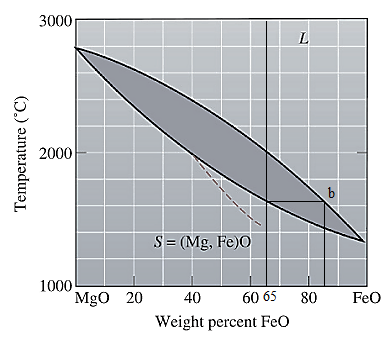
Point 'b' represents the composition of the last liquid which solidify when
(f)
Interpretation:
The phases present, their compositions and their amounts for
Concept Introduction:
On the temperature-composition graph of a ceramic, the curve above which the ceramic exist in the liquid phase is the liquidus curve. The temperature at this curve is the maximum temperature at which the crystals in the ceramic can coexist with its melt in the thermodynamic equilibrium.
Solidus curve is the locus of the temperature on the temperature composition graph of a ceramic, beyond which the ceramic is completely in solid phase.
Between the solidus and liquidus curve, the ceramic exits in a slurry form in which there is both crystals as well as ceramic melt.
Solidus temperature is always less than or equal to the liquidus temperature.
Amount of each phase in wt% is calculated using lever rule. At a particular temperature and ceramic composition, a tie line is drawn on the phase diagram of the ceramic between the solidus and liquidus curve. Then the portion of the lever opposite to the phase whose amount is to be calculated is considered in the formula used as:
Answer to Problem 10.73P
Both solid as well as liquid phases are present at the given conditions.
Composition of the liquid phase present is
Composition of the solid phase present is
Amount of the liquid phase is
Amount of the solid phase is
Explanation of Solution
The equilibrium phase diagram for the MgO-FeO system is shown below as:

Now, draw a straight line from
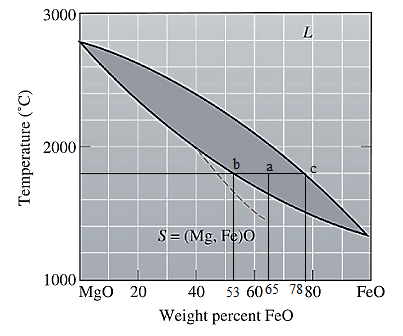
Both the phases, solid and liquid are present at this condition. Point 'b' represents the liquid phase composition in wt% and point 'c' represents the solid phase composition in wt%. From the above phase diagram:
To calculate amount of liquid phase, lever 'ac' will be used and to calculate amount of solid phase, lever 'ba' will be used. Use equation (1) to calculate the amount of each phase as:
(g)
Interpretation:
The phases present, their compositions and their amounts for
Concept Introduction:
On the temperature-composition graph of a ceramic, the curve above which the ceramic exist in the liquid phase is the liquidus curve. The temperature at this curve is the maximum temperature at which the crystals in the ceramic can coexist with its melt in the thermodynamic equilibrium.
Solidus curve is the locus of the temperature on the temperature composition graph of a ceramic, beyond which the ceramic is completely in solid phase.
Between the solidus and liquidus curve, the ceramic exits in a slurry form in which there is both crystals as well as ceramic melt.
Solidus temperature is always less than or equal to the liquidus temperature.
Amount of each phase in wt% is calculated using lever rule. At a particular temperature and ceramic composition, a tie line is drawn on the phase diagram of the ceramic between the solidus and liquidus curve. Then the portion of the lever opposite to the phase whose amount is to be calculated is considered in the formula used as:
Answer to Problem 10.73P
Explanation of Solution
The equilibrium phase diagram for the MgO-FeO system is shown below as:

Now, draw a straight line from
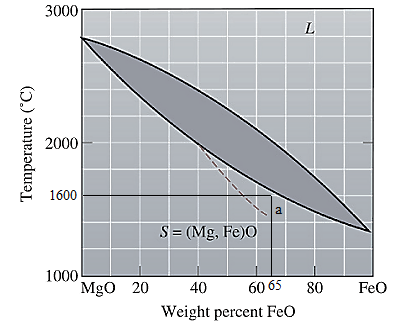
At this point 'a', only one phase is present which is solid, and it has
Want to see more full solutions like this?
Chapter 10 Solutions
Essentials of Materials Science and Engineering, SI Edition

- Please, I want the solution in two ways: Method 1 (without the Smith chart): Method 2 (using the Smith chart): A short circuit stub of length 0.04λ is used to match a 50 Ω lossless line to a load ZL = RL + j30 Ω. Use Smith chart to find:(a) The distance between the stub and the load.(b) The value of RL .arrow_forwardTHE FIRST PAGE OF THIS QUESTION SECTION BELOW IS THE FIRST IMAGE UPLOADED, WHICH SHOWS A digital synchronous sequential circuit and then comes the questions below:1B) Suppose the flip-flops are 74F74 devices and the AND gates are 74F08 devices. Let maxtpd,D=9ns, maxtsu,D=3ns, and maxtpd,AND=6ns. What is the maximum clock frequency at which the circuit can operate reliably? 2) Compare serial transmission and parallel transmission and discuss their advantages and disadvantages. 3) Explain briefly how the slave can protect itself from being overwhelmed by the master in I2 4) A hypothetical logic family has the following specifications. VOH=4.6V VIH=4.0V VOL=0.5V VIL=1.0V IOH=-1mA IIH=50μA IOL=8mA IIL=-0.6mA (4a) What are the noise margins? (4b) What is the fan-out capability?…arrow_forwardTHE FIRST PAGE OF THIS QUESTION SECTION BELOW IS THE FIRST IMAGE UPLOADED, WHICH SHOWS A digital synchronous sequential circuit and then comes the questions below:1B) Suppose the flip-flops are 74F74 devices and the AND gates are 74F08 devices. Let maxtpd,D=9ns, maxtsu,D=3ns, and maxtpd,AND=6ns. What is the maximum clock frequency at which the circuit can operate reliably? 2) Compare serial transmission and parallel transmission and discuss their advantages and disadvantages. 3) Explain briefly how the slave can protect itself from being overwhelmed by the master in I2 4) A hypothetical logic family has the following specifications. VOH=4.6V VIH=4.0V VOL=0.5V VIL=1.0V IOH=-1mA IIH=50μA IOL=8mA IIL=-0.6mA (4a) What are the noise margins? (4b) What is the fan-out capability?…arrow_forward
- This is an old practice exam. Fce = 110lb and FBCD = 62 lb but whyarrow_forwardI need help on this question a) Find y(t) =yh(t) +yp(t) in time domainIs the system over-damped, under-damped, or critical?arrow_forwardGiven f(t)=a sin(ßt) a = 10 & ß = 23 Find the Laplace Transform using the definition F(s) = ∫f(t)e-stdtarrow_forward
- = Calculate Avf, Zif, and Zof for the amplifier circuit,Assume he = 50, hie 1.1k2, and identical transistors? 150kQ Vs 5002 HH +25v 10k +6 · 47ΚΩ 47k2 4.7k0} 33 ΚΩ 4.7ΚΩ 10k w 4.7kQ HH Voarrow_forwardI help understanding this question d'y + 4dy +3y = a, Initial Conditions: y(0) = 5 & y'(0)=0 Where a = 10 a) Find y(t) =yh(t) +yp(t) in time domainIs the system over-damped, under-damped, or critical? b) Find y(t) using Laplace Transformsarrow_forwardGiven f(t)=a sin(ßt) a = 10 & ß = 23 Find the Laplace Transform using the definition F(s) = ∫f(t)e-stdtarrow_forward
- For the four-pole filter in Fig. (2), determine the capacitance values required to produce a critical frequency of 2680 Hz if all the resistors in the RC low-pass circuits are 1.8 K. Also select values for the feedback resistors to get a Butterworth response. Note: For a Butterworth response, the damping factor must be 1.848 for the first stage and 0.765 for the second stage. (2) Re Res ww " = 11arrow_forwardFor the circuit shown in Fig. 2.20, the transistors are identica' and have the following parameters: hje=50, hie = 1.1K, hr =0, and hoe = 0. Calculate Auf, Rif and Rof. Ans: 45.4; 112 KN; 129N. HH 150k 47k R 25 V 10k 47k 4.7k 5μF 33k 4.7k 50µF 50µF 4.7k 4.7k R₁ Roj R1000arrow_forwardQuiz/An eccentrically loaded bracket is welded to the support as shown in Figure below. The load is static. The weld size for weld w1 is h1 = 4mm, for w2 h2 = 6mm, and for w3 is h3 =6.5 mm. Determine the safety factor (S.f) for the welds. F=29 kN. Use an AWS Electrode type (E100xx). 163 mm S 133 mm 140 mm Please solve the question above I solved the question but I'm sure the answer is wrong the link : https://drive.google.com/file/d/1w5UD2EPDiaKSx3W33aj Rv0olChuXtrQx/view?usp=sharingarrow_forward
 MATLAB: An Introduction with ApplicationsEngineeringISBN:9781119256830Author:Amos GilatPublisher:John Wiley & Sons Inc
 Essentials Of Materials Science And EngineeringEngineeringISBN:9781337385497Author:WRIGHT, Wendelin J.Publisher:Cengage,
 Industrial Motor ControlEngineeringISBN:9781133691808Author:Stephen HermanPublisher:Cengage Learning
 Basics Of Engineering EconomyEngineeringISBN:9780073376356Author:Leland Blank, Anthony TarquinPublisher:MCGRAW-HILL HIGHER EDUCATION
 Structural Steel Design (6th Edition)EngineeringISBN:9780134589657Author:Jack C. McCormac, Stephen F. CsernakPublisher:PEARSON
 Fundamentals of Materials Science and Engineering...EngineeringISBN:9781119175483Author:William D. Callister Jr., David G. RethwischPublisher:WILEY