
(a)
Interpretation:
The liquidus temperature for
Concept Introduction:
On the temperature-composition graph of an alloy, the curve above which the alloy exists in the liquid phase is the liquidus curve. The temperature at this curve is at maximum and is known as liquidus temperature. In it, the crystals in the alloy can coexist with its melt in the
Answer to Problem 10.80P
Liquidus temperature,
Explanation of Solution
The equilibrium phase diagram for the Nb-W system is shown below as:

A straight line from
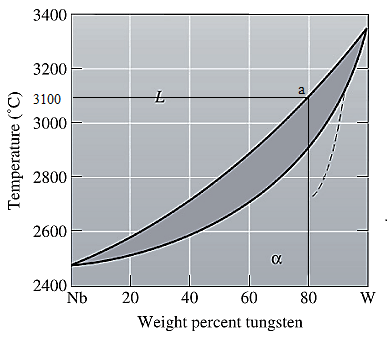
Liquidus temperature
(b)
Interpretation:
The solidus temperature for
Concept Introduction:
Solidus curve is the locus of the temperature on the temperature composition graph of an alloy, beyond which the alloy is completely in a solid phase. The temperature at this curve is minimum known as solidus temperature at which the crystals in the alloy can coexist with its melt in the thermodynamic equilibrium.
Answer to Problem 10.80P
Solidus temperature,
Explanation of Solution
The equilibrium phase diagram for the Nb-W system is shown below as:

A straight line from
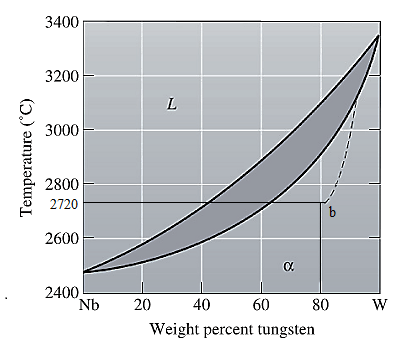
Solidus temperature
(c)
Interpretation:
The freezing range for
Concept Introduction:
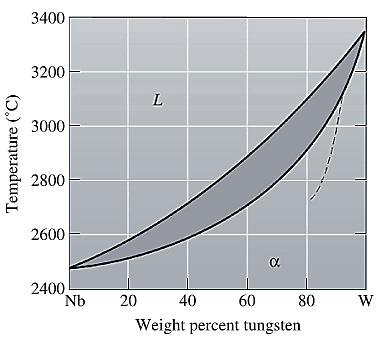
Freezing range for an alloy is the difference of the liquidus and the solidus temperature of an alloy. In this range, the alloy melt starts to crystallize at liquidus temperature and solidifies when reaches solidus temperature.
Answer to Problem 10.80P
Freezing range,
Explanation of Solution
From part (a) and (b), the liquidus and solidus temperature for the given alloy is determined as:
The freezing range (FR) for this alloy composition will be:
(d)
Interpretation:
The composition of the first solid that is formed when
Concept Introduction:
On the temperature-composition graph of an alloy, the curve above which the alloy exists in the liquid phase is the liquidus curve. The temperature at this curve is maximum known as liquidus temperature at which the crystals in the alloy can coexist with its melt in the thermodynamic equilibrium.
Answer to Problem 10.80P
The composition of the first solid formed is
Explanation of Solution
The equilibrium phase diagram for the Nb-W system is shown below as:
A straight line from

Point 'a' represents the composition of the first solid which is formed when
(e)
Interpretation:
The composition of the last liquid which is solidified when
Concept Introduction:
On the temperature-composition graph of an alloy, the curve above which the alloy exists in the liquid phase is the liquidus curve. The temperature at this curve is at maximum, is known as liquidus temperature at which the crystals in the alloy can coexist with its melt in the thermodynamic equilibrium.
Solidus curve is the locus of the temperature on the temperature composition graph of an alloy, beyond which the alloy is completely in a solid phase.
Between the solidus and liquidus curve, the alloy exits in a slurry form in which there is both crystals as well as alloy melt.
Solidus temperature is always less than or equal to the liquidus temperature.
Answer to Problem 10.80P
The composition of the last liquid solidified is
Explanation of Solution
The equilibrium phase diagram for the Nb-W system is shown below as:

A straight line from
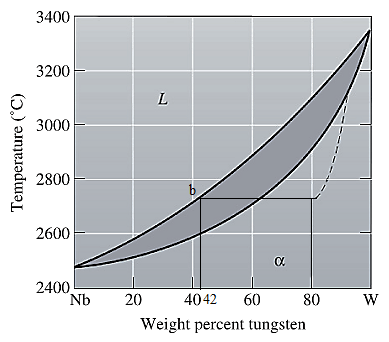
Point 'b' represents the composition of the last liquid which solidifies when
(f)
Interpretation:
The phases present, their compositions and their amounts for
Concept Introduction:
On the temperature-composition graph of an alloy, the curve above which the alloy exists in the liquid phase is the liquidus curve. The temperature at this curve is the maximum temperature at which the crystals in the alloy can coexist with its melt in the thermodynamic equilibrium.
Solidus curve is the locus of the temperature on the temperature composition graph of an alloy, beyond which the alloy is completely in a solid phase.
Between the solidus and liquidus curve, the alloy exits in a slurry form in which there is both crystals as well as alloy melt.
Solidus temperature is always less than or equal to the liquidus temperature.
Amount of each phase in wt% is calculated using lever rule. At a particular temperature and alloy composition, a tie line is drawn on the phase diagram of the alloy between the solidus and liquidus curve. Then the portion of the lever opposite to the phase whose amount is to be calculated is considered in the formula used as:
Answer to Problem 10.80P
Both solid, as well as liquid phases, are present at the given conditions.
Composition of the liquid phase present is
Composition of the solid phase present is
Amount of the liquid phase is
Amount of the solid phase is
Explanation of Solution
The equilibrium phase diagram for the Nb-W system is shown below as:

Now, draw a straight line from
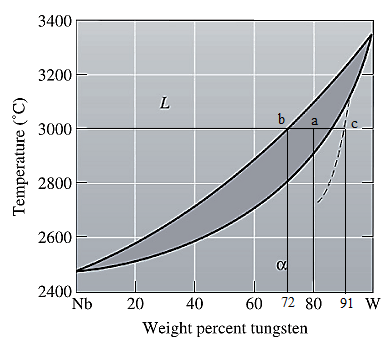
Both the phases, solid and liquid are present at this condition. Point 'b' represents the liquid phase composition in wt% and point 'c' represents the solid phase composition in wt% on the dashed curve. From the above phase diagram:
To calculate the amount of liquid phase, lever 'ac' will be used and to calculate the amount of solid phase, lever 'ba' will be used. Use equation (1) to calculate the amount of each phase as:
(g)
Interpretation:
The phases present, their compositions and their amounts for
Concept Introduction:
On the temperature-composition graph of an alloy, the curve above which the alloy exists in the liquid phase is the liquidus curve. The temperature at this curve is the maximum temperature at which the crystals in the alloy can coexist with its melt in the thermodynamic equilibrium.
Solidus curve is the locus of the temperature on the temperature composition graph of an alloy, beyond which the alloy is completely in a solid phase.
Between the solidus and liquidus curve, the alloy exits in a slurry form in which there is both crystals as well as alloy melt.
Solidus temperature is always less than or equal to the liquidus temperature.
Amount of each phase in wt% is calculated using lever rule. At a particular temperature and alloy composition, a tie line is drawn on the phase diagram of the alloy between the solidus and liquidus curve. Then the portion of the lever opposite to the phase whose amount is to be calculated is considered in the formula used as:
Answer to Problem 10.80P
Both solid, as well as liquid phases, are present at the given conditions.
Composition of the liquid phase present is
Composition of the solid phase present is
Amount of the liquid phase is
Amount of the solid phase is
Explanation of Solution
The equilibrium phase diagram for the Nb-W system is shown below as:

Now, draw a straight line from
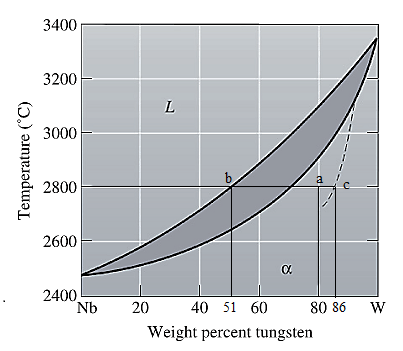
Both the phases, solid and liquid are present at this non-equilibrium condition. Point 'b' represents the liquid phase composition in wt% and point 'c' represents the solid phase composition in wt% at non-equilibrium conditions. From the above phase diagram:
To calculate the amount of liquid phase, lever 'ac' will be used and to calculate the amount of solid phase, lever 'ba' will be used. Use equation (1) to calculate the amount of each phase as:
Want to see more full solutions like this?
Chapter 10 Solutions
Essentials of Materials Science and Engineering, SI Edition

- I have uploaded the rules, please explain step by step and which rule you have appliedarrow_forwardI have uploaded the rules, please explain step by step and which rule you have appliedarrow_forwardSITUATION 3: A simply-supported steel beam 6 m long carries a uniform load of 25 kN/m and an axial compressive force of 250 kN. Assume both flange and web are compact. The properties of the rolled section are as follows: Show your complete solution and box only the final answer. Flange Width, bf = 210 mm Flange thickness, tf = 24 mm Overall depth, d=225 mm Web thickness, tw 14 mm Yield Strength, Fy=248 Mpa Radius of Gyration, ry = 54.342 mm Cb = 1.136 J = 2,097,256 mm² rts = 62.089 mm 1. Determine the total moment of inertia along x-axis. 2. Determine the total moment of inertia along y-axis 3. What is the allowable axial compressive strength of the beam, in kN? 4. What is the allowable flexural strength of the beam, in kN-m? 1. 108.764 x 106 mm* 2. 37.084 x 106 mm* 3. 982.304 KN 4. 166.723 KN-marrow_forward
- Using the CCS Compiler method to solve this question Write a PIC16F877A program that flash ON the 8-LED's connected to port-B by using two switches connected to port-D (Do & D₁) as shown in figure below, according to the following scenarios: (Hint: Use 500ms delay for each case with 4MHz frequency) 1. When Do=1 then B₁,B3,B7 are ON. 2. When Do 0 then Bo,B2, B4, B5, B6 are ON. 3. When D₁=1 then B4,B,,B6,B7 are ON. 4. When D₁-0 then Bo,B1,B2,B3 are ON.arrow_forwardsteel designarrow_forwardsteel designarrow_forward
- SITUATION 1: A W250 x 131 is used as a column with an unbraced length of 8 m with respect to the x-x axis and 4 m with respect to the y-y axis. Assume an A36 steel member, pin-connected at the top and fixed at the bottom. Assume that the column is pin connected at mid-height. Use NSCP 2001 NSCP. Fy = 250 MPa. Properties of W250 x 131: A = 16,774 mm² d=274 mm bf=262 mm tf=25 mm tw = 16 mm Ix=222.268 x 10 mm ly = 74.505 x 10° mm* Effective Length Factors: Pinned at both ends, K = 1.0 Pinned at one end and fixed at the other, K = 0.8 1. What is the value of the slenderness ratio to be used for the column? 2. What is the nominal axial stress? 3. What is the design axial load? 1. 60.019 2. 206.543 MPa 3. 3118.091 kNarrow_forwardUse the ramp generator circuit in Fig. B2a to generate the waveform shown in Fig. B2b. Write four equations relating resistors R1, R2, R3, capacitor C and voltages Vs, VR and VA.to the waveform parameters T₁, T, Vcm and Vm- If R = R2 = R3, R₁ = 2R, C = 1 nF, Vcm = 2 V and Vm = 1 V, T₁ = 2 μs and T = 10 μs solve for the values of R, Vs, VR and VA using your equations from part a(i). VR C +VA R3 V₂ Vo мат R1 VsO+ V₁ R₂ Figure B2a Vout Vcm+Vm Vcm Vcm-Vm 0 T₁ T 2T time Figure B2barrow_forwardCORRECT ANSWER ONLY WITH COMPLETE FBD. PREFERABLY HANDWRITTEN. I WILL UPVOTE 1. The beam shown carries the following loads:Total dead load, wDL = 36 kN/mConcentrated live load, PLL = 240 kNThe beam section is HSS16X12X3/8 with properties:Span, L = 6 mArea, A = 12,100 mm2Moment of inertia about x-axis, Ix = 292 x 106 mm4Fy = 345 MPa 1. Calculate the location of the live load, from the left support, for maximum moment to occur at the fixed support.Answer: 2.536 m2. Calculate the maximum moment. Answer: 439.128 kN-marrow_forward
- The circuit in Figure B1a is a common analogue circuit block. Explain why you would need such a circuit. Draw another circuit in which you use the current flowing in this loop to bias a common source amplifier. This circuit is not ideal for standard CMOS technologies due to threshold shift. Why? Draw an improved version of this circuit to make it better. VDD (W)P MA M3. (), REF (쁜)~ M₁ M2 lout 시~ Rsarrow_forwardSITUATION 2: An 8-meter simply supported beam is to be loaded, in addition to its self-weight, a triangular distributed load that linearly increases from zero at the left support to 20 kN/m (dead) + 35 kN/m (live) at the right support. It is braced laterally at the end supports and at midspan. The details for the beam cross-section are given below. Use the LRFD provisions of NSCP 2015. W 540 mm x 150 kg/m: Area, A 19,225 mm² Depth, D = 540 mm Clear Distance between Flanges, h = 455 mm Flange width, bf=310 mm Flange thickness, tf = 20 mm Web thickness, tw 12.5 mm Elastic Section Modulus, Sx = 3.72 x 106 mm³ Plastic Section Modulus, Zx = 4.14 x 10 mm³ Torsional Constant, J = 2.04 x 10% mm* Distance between flange centroids, ho = 520 mm Radius of gyration along y-axis, ry = 72 mm Cb = 1.196 Effective radius of gyration, rts = 85 mm Yield Strength of Steel, Fy = 345 MPa Modulus of Elasticity, E=200 GPa 1. What is the ultimate moment capacity of the beam, in kN-m? 1. 1285.470 kN-marrow_forward23bcarrow_forward
 MATLAB: An Introduction with ApplicationsEngineeringISBN:9781119256830Author:Amos GilatPublisher:John Wiley & Sons Inc
 Essentials Of Materials Science And EngineeringEngineeringISBN:9781337385497Author:WRIGHT, Wendelin J.Publisher:Cengage,
 Industrial Motor ControlEngineeringISBN:9781133691808Author:Stephen HermanPublisher:Cengage Learning
 Basics Of Engineering EconomyEngineeringISBN:9780073376356Author:Leland Blank, Anthony TarquinPublisher:MCGRAW-HILL HIGHER EDUCATION
 Structural Steel Design (6th Edition)EngineeringISBN:9780134589657Author:Jack C. McCormac, Stephen F. CsernakPublisher:PEARSON
 Fundamentals of Materials Science and Engineering...EngineeringISBN:9781119175483Author:William D. Callister Jr., David G. RethwischPublisher:WILEY