
(a)
Interpretation:
The liquidus temperature for NiO-MgO ceramic is to be determined.
Concept Introduction:
On the temperature-time graph of a ceramic, the first point where the deflection or the change in the slope of the cooling curve is seen is the liquidus temperature of that ceramic at which the first crystals in the ceramic can coexist with its melt in the
Answer to Problem 10.74P
Liquidus temperature,
Explanation of Solution
The cooling curve for the NiO-MgO system is shown below as:

The first change in the slope of the given cooling curve for NiO-MgO is shown below as:
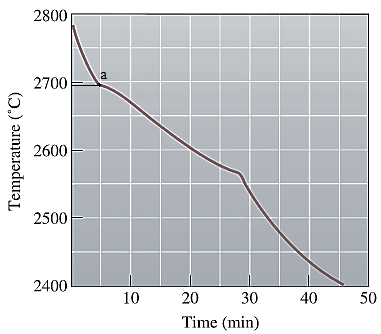
Liquidus temperature
(b)
Interpretation:
The solidus temperature for NiO-MgO ceramic is to be determined.
Concept Introduction:
On the temperature-time graph of a ceramic, the second point where the deflection or the change in the slope of the cooling curve is seen is the solidus temperature of that ceramic at which the crystals in the ceramic can coexist with its last liquid in the thermodynamic equilibrium.
Answer to Problem 10.74P
Solidus temperature,
Explanation of Solution
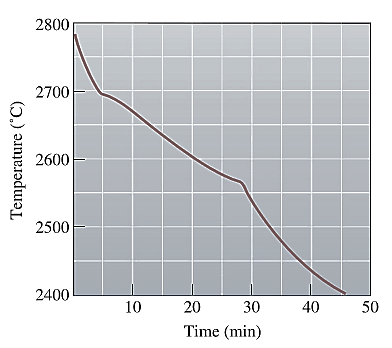
The cooling curve for the NiO-MgO system is shown below as:
The second change in the slope of the given cooling curve for NiO-MgO is shown below as:
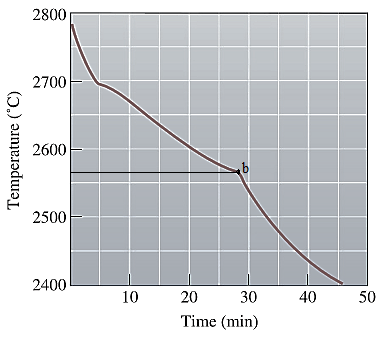
Solidus temperature
(c)
Interpretation:
The freezing range for NiO-MgO ceramic is to be determined.
Concept Introduction:
Freezing range for a ceramic is the difference of the liquidus and the solidus temperature of a ceramic. In this range, the ceramic melt starts to crystallize at liquidus temperature and solidifies when it reaches the solidus temperature.
Answer to Problem 10.74P
Freezing range,
Explanation of Solution
From part (a) and (b), the liquidus and solidus temperature for the given ceramic is determined as:
The freezing range (FR) for this ceramic composition will be:
(d)
Interpretation:
The pouring temperature of the NiO-MgO ceramic is to be determined.
Concept Introduction:
The temperature at which the material is poured into the cast and then allowed to cool thereafter is known as the pouring temperature.
On a cooling curve (temperature-time), pouring temperature is the starting point temperature.
Answer to Problem 10.74P
Pouring temperature,
Explanation of Solution
The cooling curve for the NiO-MgO system is shown below as:

From this curve, the temperature when the ceramic is poured to be casted is determined as:
(e)
Interpretation:
The superheat for the given NiO-MgO ceramic is to be determined.
Concept Introduction:
Superheat for a material is defined as the difference in the pouring temperature and the liquidus temperature of the casting material.
Answer to Problem 10.74P
Superheat is determined as
Explanation of Solution
From part (a) and (d), the liquidus and pouring temperature for the given ceramic is determined as:
The superheat for this ceramic composition will be:
(f)
Interpretation:
The local solidification time for the given NiO-MgO ceramic is to be determined.
Concept Introduction:
The time needed to only remove the latent heat of fusion in the casting at a particular location is known as the local solidification time. It is measured from the point of the start of the solidification until the end of it.
Answer to Problem 10.74P
Local solidification time is,
Explanation of Solution
The cooling curve for the NiO-MgO system is shown below as:

Solidification starts at the liquidus temperature and ends at the solidus temperature marked on the above graph as shown below:
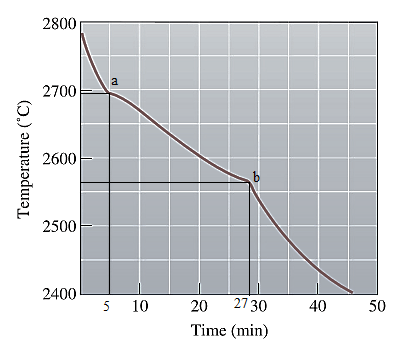
Point 'a' represents the liquidus temperature and the time when solidification starts is
Point 'b' represents the solidus temperature and the time at which solidification stops is
Local solidification time is now calculated as:
(g)
Interpretation:
The total solidification time for the given NiO-MgO ceramic is to be determined.
Concept Introduction:
The time needed to remove the latent heat of fusion as well as the specific heat of the liquid in the casting at a particular location is known as the total solidification time. It is measured from the time of pouring until the end of the solidification.
Answer to Problem 10.74P
Total solidification time is,
Explanation of Solution
The cooling curve for the NiO-MgO system is shown below as:

Time at the pouring temperature is
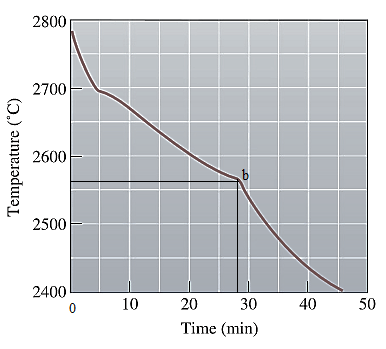
Point 'b' represents the solidus temperature and the time at which solidification stops is
Total solidification time is now calculated as:
(h)
Interpretation:
The composition of the given NiO-MgO ceramic is to be determined.
Concept Introduction:
On the temperature-composition graph of a ceramic, the curve above which the ceramic exist in the liquid phase is the liquidus curve. The temperature at this curve is the maximum temperature at which the crystals in the ceramic can coexist with its melted form in the thermodynamic equilibrium.
Solidus curve is the locus of the temperature on the temperature composition graph of an alloy, beyond which the alloy is completely in solid phase. The temperature at this curve is minimum known as solidus temperature at which the crystals in the alloy can coexist with its melt in the thermodynamic equilibrium.
Answer to Problem 10.74P
Composition of the ceramic is
Explanation of Solution
The equilibrium phase diagram for the NiO-MgO system is shown below as:
From part (a) and (b), the liquidus and solidus temperature are determined as:
Mark both the temperatures on the NiO-MgO graph as shown below:
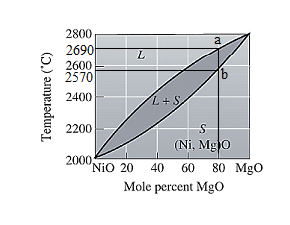
Point 'a' and 'b' both fall on the same composition of the ceramic which is
Want to see more full solutions like this?
Chapter 10 Solutions
Essentials of Materials Science and Engineering, SI Edition

- I have uploaded the rules, please explain step by step and which rule you have appliedarrow_forwardpls match the ans key, someone gave me a wrong ans.arrow_forwardDraw the network diagram of the following Table using PERT and determine Te, Sd, V, ES, LF, Ts and C. P. Find the probability P if D =27 weeks. Activities Prec. by To Tm Tp Te SD V ES LF Ts C.P A -- HW2 11 22U118243 10 10 1985762323443 26624452-2232 B A C -- D C E D F D G F H B, E 1 I G, H J B K J L K, I 4654arrow_forward
- For the beam and loading shown, (a) draw the shear and bending moment diagrams, (b) determine the magnitude and location of the maximum absolute value of the bending momentConsider A = 0please show step by step process, i did something wrong with bending moment diagram( length of beam = 2 + 6 + 2)arrow_forwardI have uploaded the rules, please explain step by step and which rule you have appliedarrow_forwardI have uploaded the rules, please explain step by step and which rule you have appliedarrow_forward
- SITUATION 3: A simply-supported steel beam 6 m long carries a uniform load of 25 kN/m and an axial compressive force of 250 kN. Assume both flange and web are compact. The properties of the rolled section are as follows: Show your complete solution and box only the final answer. Flange Width, bf = 210 mm Flange thickness, tf = 24 mm Overall depth, d=225 mm Web thickness, tw 14 mm Yield Strength, Fy=248 Mpa Radius of Gyration, ry = 54.342 mm Cb = 1.136 J = 2,097,256 mm² rts = 62.089 mm 1. Determine the total moment of inertia along x-axis. 2. Determine the total moment of inertia along y-axis 3. What is the allowable axial compressive strength of the beam, in kN? 4. What is the allowable flexural strength of the beam, in kN-m? 1. 108.764 x 106 mm* 2. 37.084 x 106 mm* 3. 982.304 KN 4. 166.723 KN-marrow_forwardUsing the CCS Compiler method to solve this question Write a PIC16F877A program that flash ON the 8-LED's connected to port-B by using two switches connected to port-D (Do & D₁) as shown in figure below, according to the following scenarios: (Hint: Use 500ms delay for each case with 4MHz frequency) 1. When Do=1 then B₁,B3,B7 are ON. 2. When Do 0 then Bo,B2, B4, B5, B6 are ON. 3. When D₁=1 then B4,B,,B6,B7 are ON. 4. When D₁-0 then Bo,B1,B2,B3 are ON.arrow_forwardsteel designarrow_forward
- steel designarrow_forwardSITUATION 1: A W250 x 131 is used as a column with an unbraced length of 8 m with respect to the x-x axis and 4 m with respect to the y-y axis. Assume an A36 steel member, pin-connected at the top and fixed at the bottom. Assume that the column is pin connected at mid-height. Use NSCP 2001 NSCP. Fy = 250 MPa. Properties of W250 x 131: A = 16,774 mm² d=274 mm bf=262 mm tf=25 mm tw = 16 mm Ix=222.268 x 10 mm ly = 74.505 x 10° mm* Effective Length Factors: Pinned at both ends, K = 1.0 Pinned at one end and fixed at the other, K = 0.8 1. What is the value of the slenderness ratio to be used for the column? 2. What is the nominal axial stress? 3. What is the design axial load? 1. 60.019 2. 206.543 MPa 3. 3118.091 kNarrow_forwardUse the ramp generator circuit in Fig. B2a to generate the waveform shown in Fig. B2b. Write four equations relating resistors R1, R2, R3, capacitor C and voltages Vs, VR and VA.to the waveform parameters T₁, T, Vcm and Vm- If R = R2 = R3, R₁ = 2R, C = 1 nF, Vcm = 2 V and Vm = 1 V, T₁ = 2 μs and T = 10 μs solve for the values of R, Vs, VR and VA using your equations from part a(i). VR C +VA R3 V₂ Vo мат R1 VsO+ V₁ R₂ Figure B2a Vout Vcm+Vm Vcm Vcm-Vm 0 T₁ T 2T time Figure B2barrow_forward
 MATLAB: An Introduction with ApplicationsEngineeringISBN:9781119256830Author:Amos GilatPublisher:John Wiley & Sons Inc
 Essentials Of Materials Science And EngineeringEngineeringISBN:9781337385497Author:WRIGHT, Wendelin J.Publisher:Cengage,
 Industrial Motor ControlEngineeringISBN:9781133691808Author:Stephen HermanPublisher:Cengage Learning
 Basics Of Engineering EconomyEngineeringISBN:9780073376356Author:Leland Blank, Anthony TarquinPublisher:MCGRAW-HILL HIGHER EDUCATION
 Structural Steel Design (6th Edition)EngineeringISBN:9780134589657Author:Jack C. McCormac, Stephen F. CsernakPublisher:PEARSON
 Fundamentals of Materials Science and Engineering...EngineeringISBN:9781119175483Author:William D. Callister Jr., David G. RethwischPublisher:WILEY