
(a)
Interpretation:
The liquidus temperature for
Concept Introduction:
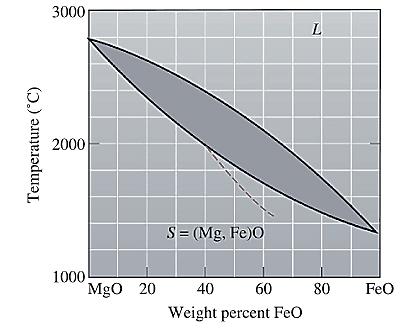
On the temperature-composition graph of a ceramic, the curve above which the ceramic exist in the liquid phase is the liquidus curve. The temperature at this curve is maximum known as liquidus temperature at which the crystals in the ceramic can coexist with its melt in the
Answer to Problem 10.79P
Liquidus temperature,
Explanation of Solution
The equilibrium phase diagram for the MgO-FeO system is shown below as:

A straight line from
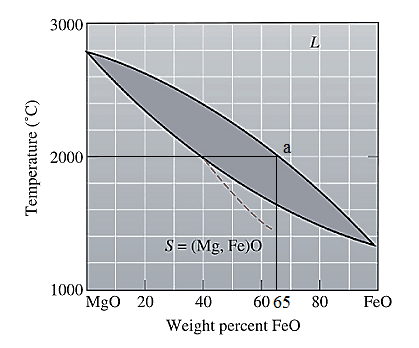
Liquidus temperature
(b)
Interpretation:
The solidus temperature for
Concept Introduction:
Solidus curve is the locus of the temperature on the temperature composition graph of a ceramic, beyond which the ceramic is completely in solid phase. The temperature at this curve is minimum known as solidus temperature at which the crystals in the ceramic can coexist with its melt in the thermodynamic equilibrium.
Answer to Problem 10.79P
Solidus temperature,
Explanation of Solution
The equilibrium phase diagram for the MgO-FeO system is shown below as:

A straight line from
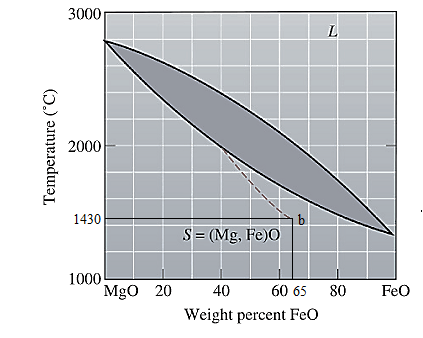
Solidus temperature
(c)
Interpretation:
The freezing range for
Concept Introduction:
Freezing range for a ceramic is the difference of the liquidus and the solidus temperature of anceramic. In this range, the ceramic melt starts to crystallize at liquidus temperature and solidifies when reaches solidus temperature.
Answer to Problem 10.79P
Freezing range,
Explanation of Solution
From part (a) and (b), the liquidus and solidus temperature for the given ceramic is determined as:
The freezing range (FR) for this ceramic composition will be:
(d)
Interpretation:
The composition of the first solid that is formed when
Concept Introduction:
On the temperature-composition graph of a ceramic, the curve above which the ceramic exist in the liquid phase is the liquidus curve. The temperature at this curve is maximum known as liquidus temperature at which the crystals in the ceramic can coexist with its melt in the thermodynamic equilibrium.
Answer to Problem 10.79P
The composition of the first solid formed is
Explanation of Solution
The equilibrium phase diagram for the MgO-FeO system is shown below as:

A straight line from
Point 'a' represents the composition of the first solid which is formed when
(e)
Interpretation:
The composition of the last liquid which is solidified when
Concept Introduction:
On the temperature-composition graph of a ceramic, the curve above which the ceramic exist in the liquid phase is the liquidus curve. The temperature at this curve is maximum known as liquidus temperature at which the crystals in the ceramic can coexist with its melt in the thermodynamic equilibrium.
Solidus curve is the locus of the temperature on the temperature composition graph of a ceramic, beyond which the ceramic is completely in solid phase.
Between the solidus and liquidus curve, the ceramic exits in a slurry form in which there is both crystals as well as ceramic melt.
Solidus temperature is always less than or equal to the liquidus temperature.
Answer to Problem 10.79P
The composition of the last liquid solidified is
Explanation of Solution
The equilibrium phase diagram for the MgO-FeO system is shown below as:

A straight line from
Point 'b' represents the composition of the last liquid which solidify when
(f)
Interpretation:
The phases present, their compositions and their amounts for
Concept Introduction:
On the temperature-composition graph of a ceramic, the curve above which the ceramic exist in the liquid phase is the liquidus curve. The temperature at this curve is the maximum temperature at which the crystals in the ceramic can coexist with its melt in the thermodynamic equilibrium.
Solidus curve is the locus of the temperature on the temperature composition graph of a ceramic, beyond which the ceramic is completely in solid phase.
Between the solidus and liquidus curve, the ceramic exits in a slurry form in which there is both crystals as well as ceramic melt.
Solidus temperature is always less than or equal to the liquidus temperature.
Amount of each phase in wt% is calculated using lever rule. At a particular temperature and ceramic composition, a tie line is drawn on the phase diagram of the ceramic between the solidus and liquidus curve. Then the portion of the lever opposite to the phase whose amount is to be calculated is considered in the formula used as:
Answer to Problem 10.79P
Both solid as well as liquid phases are present at the given conditions.
Composition of the liquid phase present is
Composition of the solid phase present is
Amount of the liquid phase is
Amount of the solid phase is
Explanation of Solution
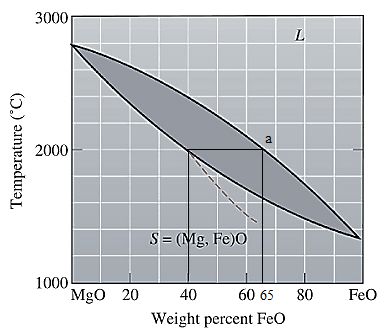
The equilibrium phase diagram for the MgO-FeO system is shown below as:
Now, draw a straight line from
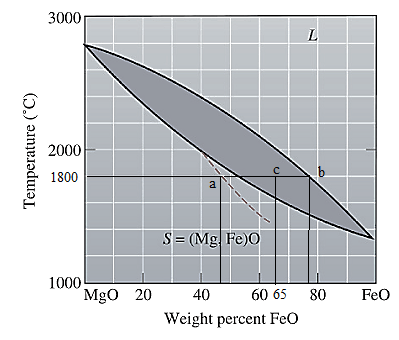
Both the phases, solid and liquid are present at this condition. Point 'b' represents the liquid phase composition in wt% and point 'a' represents the solid phase composition in wt% at non-equilibrium conditions. From the above phase diagram:
To calculate amount of liquid phase, lever 'ac' will be used and to calculate amount of solid phase, lever 'bc' will be used. Use equation (1) to calculate the amount of each phase as:
(g)
Interpretation:
The phases present, their compositions and their amounts for
Concept Introduction:
On the temperature-composition graph of a ceramic, the curve above which the ceramic exist in the liquid phase is the liquidus curve. The temperature at this curve is the maximum temperature at which the crystals in the ceramic can coexist with its melt in the thermodynamic equilibrium.
Solidus curve is the locus of the temperature on the temperature composition graph of a ceramic, beyond which the ceramic is completely in solid phase.
Between the solidus and liquidus curve, the ceramic exits in a slurry form in which there is both crystals as well as ceramic melt.
Solidus temperature is always less than or equal to the liquidus temperature.
Amount of each phase in wt% is calculated using lever rule. At a particular temperature and ceramic composition, a tie line is drawn on the phase diagram of the ceramic between the solidus and liquidus curve. Then the portion of the lever opposite to the phase whose amount is to be calculated is considered in the formula used as:
Answer to Problem 10.79P
Both solid as well as liquid phases are present at the given conditions.
Composition of the liquid phase present is
Composition of the solid phase present is
Amount of the liquid phase is
Amount of the solid phase is
Explanation of Solution
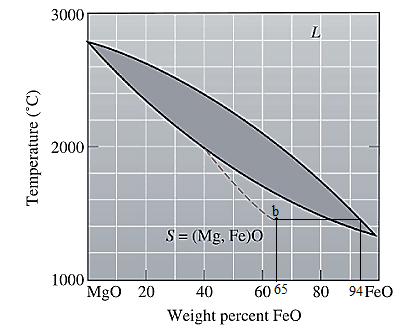
The equilibrium phase diagram for the MgO-FeO system is shown below as:

Now, draw a straight line from
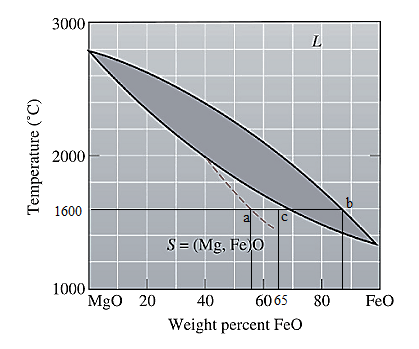
Both the phases, solid and liquid are present at this condition. Point 'b' represents the liquid phase composition in wt% and point 'a' represents the solid phase composition in wt% at non-equilibrium conditions. From the above phase diagram:
To calculate amount of liquid phase, lever 'ac' will be used and to calculate amount of solid phase, lever 'bc' will be used. Use equation (1) to calculate the amount of each phase as:
Want to see more full solutions like this?
Chapter 10 Solutions
Essentials of Materials Science and Engineering, SI Edition

- Given f(t)=a sin(ßt) a = 10 & ß = 23 Find the Laplace Transform using the definition F(s) = ∫f(t)e-stdtarrow_forwardFor the four-pole filter in Fig. (2), determine the capacitance values required to produce a critical frequency of 2680 Hz if all the resistors in the RC low-pass circuits are 1.8 K. Also select values for the feedback resistors to get a Butterworth response. Note: For a Butterworth response, the damping factor must be 1.848 for the first stage and 0.765 for the second stage. (2) Re Res ww " = 11arrow_forwardFor the circuit shown in Fig. 2.20, the transistors are identica' and have the following parameters: hje=50, hie = 1.1K, hr =0, and hoe = 0. Calculate Auf, Rif and Rof. Ans: 45.4; 112 KN; 129N. HH 150k 47k R 25 V 10k 47k 4.7k 5μF 33k 4.7k 50µF 50µF 4.7k 4.7k R₁ Roj R1000arrow_forward
- Quiz/An eccentrically loaded bracket is welded to the support as shown in Figure below. The load is static. The weld size for weld w1 is h1 = 4mm, for w2 h2 = 6mm, and for w3 is h3 =6.5 mm. Determine the safety factor (S.f) for the welds. F=29 kN. Use an AWS Electrode type (E100xx). 163 mm S 133 mm 140 mm Please solve the question above I solved the question but I'm sure the answer is wrong the link : https://drive.google.com/file/d/1w5UD2EPDiaKSx3W33aj Rv0olChuXtrQx/view?usp=sharingarrow_forwardA triangular wave is applied to the input of Fig. (3). Determine what the output should be and sketch its waveform in relation to the input. 10μs. 0 5μs 15 μs 0.001 μF R₁ w 2.2karrow_forwardA three-phase, 480-V, 60-Hz, 6-pole, Y-connected induction motor has its speed controlled by slip power. The circuit parameters are given: Rs=0.06 ohms, Rr=0.05 ohms, Xs=0.2 ohms, Xr=0.3 ohms and Xm=6 ohms. The turn ratio of the rotor to stator winding is n=0.8. The no-load losses of the motor are equal to 150 W. The rotor and stator cupper losses are equal to 249.21 W. The slip power losses are estimated to 8000W. The load torque is 173.61 N.m. at 700 rpm. The efficiency is equal to: Select one: a. 71.5% b. None of these c. 81.5% d. 91.5% Question 2 Consider a 3-phase, 460-V, 100-hp, 0.88 power factor lagging, 4-pole, 1728 RPM, 60 Hz, Y-connected induction motor. The operating slip is equal to: Select one: a. 0.05 b. 0.01 c. 0.04 d. None of these Question 3 A 3 phase, 10 kW, 1750 rpm, Y- connected 460 V, 60 Hz, 4 poles, Y-connected induction motor has the following parameters: Rs = 0.5 Ohms, Rr = 0.3 Ohms, Xs = 0.9 Ohms, Xr = 0.9 Ohms, Xm = 25 Ohms. The no load…arrow_forward
- Q2: (15 Marks) A water-LiBr vapor absorption system incorporates a heat exchanger as shown in the figure. The temperatures of the evaporator, the absorber, the condenser, and the generator are 10°C, 25°C, 40°C, and 100°C respectively. The strong liquid leaving the pump is heated to 50°C in the heat exchanger. The refrigerant flow rate through the condenser is 0.12 kg/s. Calculate (i) the heat rejected in the absorber, and (ii) the COP of the cycle. Yo 8 XE-V lo 9 Pc 7 condenser 5 Qgen PG 100 Qabs Pe evaporator PRV 6 PA 10 3 generator heat exchanger 2 pump 185 absorberarrow_forwardThis is my answer to the question and they want me to explainarrow_forwardQ5:(? Design the duct system of the figure below by using the balanced pressure method. The velocity in the duct attached to the AHU must not exceed 5m/s. The pressure loss for each diffuser is equal to 10Pa. 100CFM 100CFM 100CFM ☑ ☑ 40m AHU -16m- 8m- -12m- 57m 250CFM 40m -14m- 26m 36m ☑ 250CFMarrow_forward
- electric plants do for hand writingarrow_forwardA mass of ideal gas in a closed piston-cylinder system expands from 427 °C and 16 bar following the process law, pv1.36 = Constant (p times v to the power of 1.36 equals to a constant). For the gas, initial : final pressure ratio is 4:1 and the initial gas volume is 0.14 m³. The specific heat of the gas at constant pressure, Cp = 0.987 kJ/kg-K and the specific gas constant, R = 0.267 kJ/kg.K. Determine the change in total internal energy in the gas during the expansion. Enter your numerical answer in the answer box below in KILO JOULES (not in Joules) but do not enter the units. (There is no expected number of decimal points or significant figures).arrow_forwardheat and mass transferarrow_forward
 MATLAB: An Introduction with ApplicationsEngineeringISBN:9781119256830Author:Amos GilatPublisher:John Wiley & Sons Inc
 Essentials Of Materials Science And EngineeringEngineeringISBN:9781337385497Author:WRIGHT, Wendelin J.Publisher:Cengage,
 Industrial Motor ControlEngineeringISBN:9781133691808Author:Stephen HermanPublisher:Cengage Learning
 Basics Of Engineering EconomyEngineeringISBN:9780073376356Author:Leland Blank, Anthony TarquinPublisher:MCGRAW-HILL HIGHER EDUCATION
 Structural Steel Design (6th Edition)EngineeringISBN:9780134589657Author:Jack C. McCormac, Stephen F. CsernakPublisher:PEARSON
 Fundamentals of Materials Science and Engineering...EngineeringISBN:9781119175483Author:William D. Callister Jr., David G. RethwischPublisher:WILEY