Concept explainers
a.
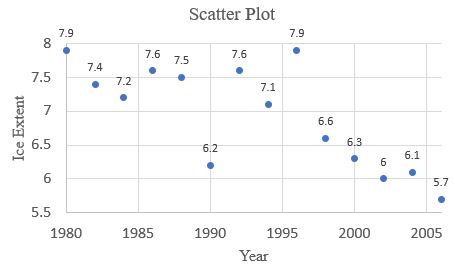
Sketch a
a.
Answer to Problem 6P
The scatter plot is

Explanation of Solution
Given: The data set is,
Calculation:
Using Excel to scetch a scatter plot.
- Write the data in the excel and plot using chart “scatter”.
b.
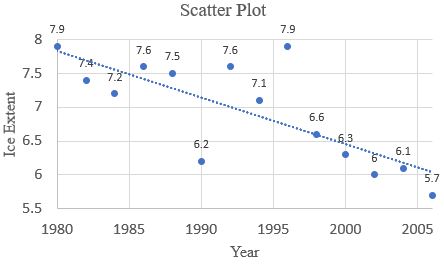
Draw a regression line.
b.
Answer to Problem 6P
The graph is,

Explanation of Solution
Given: The data set is,
Calculation:
The regression line is defined as,
Find the value of a and b using relation,
After simplifying the value of a and b, put into the equation (1) and get the solution.
Using Excel to scetch a scatter plot.
- Write the data in the excel and plot using chart “scatter”.
c.
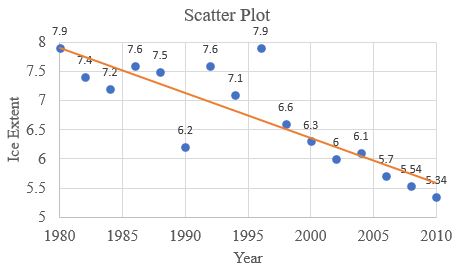
Calculate ice extent in 2010 using linear model.
c.
Answer to Problem 6P
The ice extent in year 2010 is,

Explanation of Solution
Given: The data set is,
Calculation:
Using Excel to scetch a scatter plot.
- Write the data in the excel and plot using chart “scatter”.
Chapter 1 Solutions
EBK PRECALCULUS: MATHEMATICS FOR CALCUL
- Calculus lll May I please have an explanation about how to calculate the derivative of the surface (the dS) on the surface integral, and then explain the essentials of the surface integral?arrow_forwardУ1 = e is a solution to the differential equation xy" — (x+1)y' + y = 0. Use reduction of order to find the solution y(x) corresponding to the initial data y(1) = 1, y′ (1) = 0. Then sin(y(2.89)) is -0.381 0.270 -0.401 0.456 0.952 0.981 -0.152 0.942arrow_forwardsolve pleasearrow_forward
- The parametric equations of the function are given asx=asin²0, y = acos). Calculate [Let: a=anumerical coefficient] dy d²y and dx dx2arrow_forwardA tank contains 200 gal of fresh water. A solution containing 4 lb/gal of soluble lawn fertilizer runs into the tank at the rate of 1 gal/min, and the mixture is pumped out of the tank at the rate of 5 gal/min. Find the maximum amount of fertilizer in the tank and the time required to reach the maximum. Find the time required to reach the maximum amount of fertilizer in the tank. t= min (Type an integer or decimal rounded to the nearest tenth as needed.)arrow_forwardThumbi Irrigation Scheme in Mzimba district is under threat of flooding. In order to mitigate against the problem, authorities have decided to construct a flood protection bund (Dyke). Figure 1 is a cross section of a 300m long proposed dyke; together with its foundation (key). Survey data for the proposed site of the dyke are presented in Table 1. Table 2 provides swelling and shrinkage factors for the fill material that has been proposed. The dyke dimensions that are given are for a compacted fill. (1) Assume you are in the design office, use both the Simpson Rule and Trapezoidal Rule to compute the total volume of earthworks required. (Assume both the dyke and the key will use the same material). (2) If you are a Contractor, how many days will it take to finish hauling the computed earthworks using 3 tippers of 12m³ each? Make appropriate assumptions. DIKE CROSS SECTION OGL KEY (FOUNDATION) 2m 1m 2m 8m Figure 1: Cross section of Dyke and its foundation 1.5m from highest OGL 0.5m…arrow_forward
- The parametric equations of the function are given as x = 3cos 0 - sin³0 and y = 3sin 0 - cos³0. dy d2y Calculate and dx dx².arrow_forward(10 points) Let f(x, y, z) = ze²²+y². Let E = {(x, y, z) | x² + y² ≤ 4,2 ≤ z ≤ 3}. Calculate the integral f(x, y, z) dv. Earrow_forward(12 points) Let E={(x, y, z)|x²+ y² + z² ≤ 4, x, y, z > 0}. (a) (4 points) Describe the region E using spherical coordinates, that is, find p, 0, and such that (x, y, z) (psin cos 0, psin sin 0, p cos) € E. (b) (8 points) Calculate the integral E xyz dV using spherical coordinates.arrow_forward
- (10 points) Let f(x, y, z) = ze²²+y². Let E = {(x, y, z) | x² + y² ≤ 4,2 ≤ z < 3}. Calculate the integral y, f(x, y, z) dV.arrow_forward(14 points) Let f: R3 R and T: R3. →R³ be defined by f(x, y, z) = ln(x²+ y²+2²), T(p, 0,4)=(psin cos 0, psin sin, pcos). (a) (4 points) Write out the composition g(p, 0, 4) = (foT)(p,, ) explicitly. Then calculate the gradient Vg directly, i.e. without using the chain rule. (b) (4 points) Calculate the gradient Vf(x, y, z) where (x, y, z) = T(p, 0,4). (c) (6 points) Calculate the derivative matrix DT(p, 0, p). Then use the Chain Rule to calculate Vg(r,0,4).arrow_forward(10 points) Let S be the upper hemisphere of the unit sphere x² + y²+2² = 1. Let F(x, y, z) = (x, y, z). Calculate the surface integral J F F-dS. Sarrow_forward
 Calculus: Early TranscendentalsCalculusISBN:9781285741550Author:James StewartPublisher:Cengage Learning
 Thomas' Calculus (14th Edition)CalculusISBN:9780134438986Author:Joel R. Hass, Christopher E. Heil, Maurice D. WeirPublisher:PEARSON
 Calculus: Early Transcendentals (3rd Edition)CalculusISBN:9780134763644Author:William L. Briggs, Lyle Cochran, Bernard Gillett, Eric SchulzPublisher:PEARSON
 Calculus: Early TranscendentalsCalculusISBN:9781319050740Author:Jon Rogawski, Colin Adams, Robert FranzosaPublisher:W. H. Freeman
 Calculus: Early Transcendental FunctionsCalculusISBN:9781337552516Author:Ron Larson, Bruce H. EdwardsPublisher:Cengage Learning


