Videos
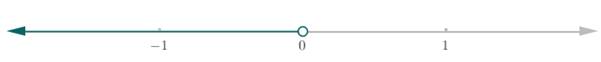
Graph the inequality
Explanation of Solution
Given:
The inequality:
Concept Used:
To plot an inequality, such as x>3, on a number line, first draw a circle over the number (e.g., 3). Then if the sign includes equal to (= or =), fill in the circle. If the sign does not include equal to (> or <), leave the circle unfilled in.
For = and <, the arrow points down to the left.
For = and >, the arrow points up to the right.
Calculation:
1) Draw a number line. 2) Put either an open circle or a closed dot above the number given. For = and = , use a closed dot to indicate the number itself is part of the solution. For < and >, use an open circle to indicate the number itself is not part of the solution
A closed, or shaded, circle is used to represent the inequalities greater than or equal to (
An open circle is used for greater than (>) or less than (<). The point is not part of the solution. The graph then extends endlessly in one direction.
For = and <, the arrow points down to the left.
Chapter 8 Solutions
Glencoe Math Accelerated, Student Edition
Additional Math Textbook Solutions
Calculus: Early Transcendentals (2nd Edition)
Introductory Statistics
Elementary Statistics (13th Edition)
A Problem Solving Approach To Mathematics For Elementary School Teachers (13th Edition)
University Calculus: Early Transcendentals (4th Edition)
Basic Business Statistics, Student Value Edition


- I need the last answer t=? I did got the answer for the first two this is just homework.arrow_forward7) 8) Let R be the region bounded by the given curves as shown in the figure. If the line x = k divides R into two regions of equal area, find the value of k 7. y = 3√x, y = √x and x = 4 8. y = -2, y = 3, x = −3, and x = −1 -1 2 +1 R Rarrow_forwardSolve this question and show steps.arrow_forward
- u, v and w are three coplanar vectors: ⚫ w has a magnitude of 10 and points along the positive x-axis ⚫ v has a magnitude of 3 and makes an angle of 58 degrees to the positive x- axis ⚫ u has a magnitude of 5 and makes an angle of 119 degrees to the positive x- axis ⚫ vector v is located in between u and w a) Draw a diagram of the three vectors placed tail-to-tail at the origin of an x-y plane. b) If possible, find w × (ū+v) Support your answer mathematically or a with a written explanation. c) If possible, find v. (ū⋅w) Support your answer mathematically or a with a written explanation. d) If possible, find u. (vxw) Support your answer mathematically or a with a written explanation. Note: in this question you can work with the vectors in geometric form or convert them to algebraic vectors.arrow_forwardQuestion 3 (6 points) u, v and w are three coplanar vectors: ⚫ w has a magnitude of 10 and points along the positive x-axis ⚫ v has a magnitude of 3 and makes an angle of 58 degrees to the positive x- axis ⚫ u has a magnitude of 5 and makes an angle of 119 degrees to the positive x- axis ⚫ vector v is located in between u and w a) Draw a diagram of the three vectors placed tail-to-tail at the origin of an x-y plane. b) If possible, find w × (u + v) Support your answer mathematically or a with a written explanation. c) If possible, find v. (ū⋅ w) Support your answer mathematically or a with a written explanation. d) If possible, find u (v × w) Support your answer mathematically or a with a written explanation. Note: in this question you can work with the vectors in geometric form or convert them to algebraic vectors.arrow_forwardK Find all values x = a where the function is discontinuous. For each value of x, give the limit of the function as x approaches a. Be sure to note when the limit doesn't exist. x-7 p(x) = X-7 Select the correct choice below and, if necessary, fill in the answer box(es) within your choice. (Use a comma to separate answers as needed.) OA. f is discontinuous at the single value x = OB. f is discontinuous at the single value x= OC. f is discontinuous at the two values x = OD. f is discontinuous at the two values x = The limit is The limit does not exist and is not co or - ∞. The limit for the smaller value is The limit for the larger value is The limit for the smaller value is The limit for the larger value does not exist and is not c∞ or -arrow_forward
- K x3 +216 complete the table and use the results to find lim k(x). If k(x) = X+6 X-6 X -6.1 -6.01 - 6.001 - 5.999 - 5.99 -5.9 k(x) Complete the table. X -6.1 -6.01 - 6.001 - 5.999 - 5.99 - 5.9 k(x) (Round to three decimal places as needed.) Find the limit. Select the correct choice below and, if necessary, fill in the answer box within your choice.arrow_forwardSketch the slope field that represents the differential equation. × Clear Undo Redo y ४|० || 33 dy dxarrow_forwardSketch the slope field that represents the differential equation. × Clear Undo Redo dy 33 dx = -y "arrow_forward
- Math Test 3 3 x³+y³ = Ꭹ = 9 2 2 x²+y² = 5 x+y=?arrow_forwardFor each of the following series, determine whether the absolute convergence series test determines absolute convergence or fails. For the ¿th series, if the test is inconclusive then let Mi = 4, while if the test determines absolute convergence let Mi 1 : 2: ∞ Σ(−1)"+¹ sin(2n); n=1 Σ n=1 Σ ((−1)”. COS n² 3+2n4 3: (+ 4: 5 : n=1 ∞ n 2+5n3 ПП n² 2 5+2n3 пп n² Σ(+)+ n=1 ∞ n=1 COS 4 2 3+8n3 П ηπ n- (−1)+1 sin (+727) 5 + 2m³ 4 = 8. Then the value of cos(M₁) + cos(2M2) + cos(3M3) + sin(2M) + sin(M5) is -0.027 -0.621 -1.794 -1.132 -1.498 -4.355 -2.000 2.716arrow_forwardi need help with this question i tried by myself and so i am uploadding the question to be quided with step by step solution and please do not use chat gpt i am trying to learn thank you.arrow_forward
 Calculus: Early TranscendentalsCalculusISBN:9781285741550Author:James StewartPublisher:Cengage Learning
 Thomas' Calculus (14th Edition)CalculusISBN:9780134438986Author:Joel R. Hass, Christopher E. Heil, Maurice D. WeirPublisher:PEARSON
 Calculus: Early Transcendentals (3rd Edition)CalculusISBN:9780134763644Author:William L. Briggs, Lyle Cochran, Bernard Gillett, Eric SchulzPublisher:PEARSON
 Calculus: Early TranscendentalsCalculusISBN:9781319050740Author:Jon Rogawski, Colin Adams, Robert FranzosaPublisher:W. H. Freeman
 Calculus: Early Transcendental FunctionsCalculusISBN:9781337552516Author:Ron Larson, Bruce H. EdwardsPublisher:Cengage Learning