
Essentials of Business Analytics (MindTap Course List)
2nd Edition
ISBN: 9781305627734
Author: Jeffrey D. Camm, James J. Cochran, Michael J. Fry, Jeffrey W. Ohlmann, David R. Anderson
Publisher: Cengage Learning
expand_more
expand_more
format_list_bulleted
Videos
Textbook Question
Chapter 8, Problem 16P
The following table reports the percentage of stocks in a portfolio for nine quarters:
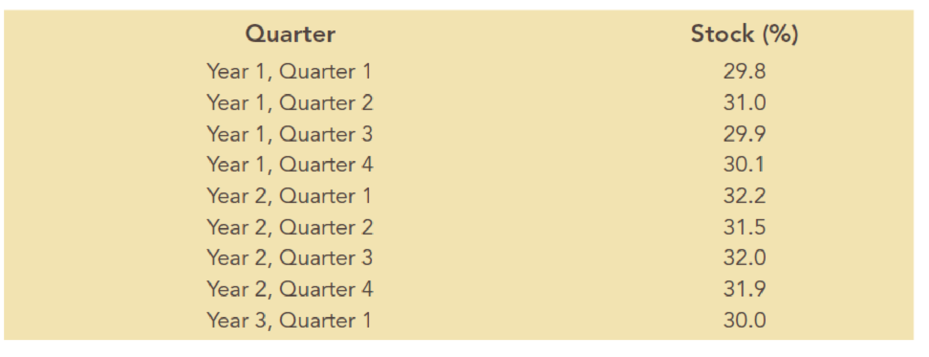
- a. Construct a time series plot. What type of pattern exists in the data?
- b. Use trial and error to find a value of the exponential smoothing coefficient α that results in a relatively small MSE.
- c. Using the exponential smoothing model you developed in part (b), what is the forecast of the percentage of stocks in a typical portfolio for the second quarter of year 3?
Expert Solution & Answer
Want to see the full answer?
Check out a sample textbook solution
Students have asked these similar questions
The following table reports the percentage of stocks in a portfolio for nine quarters:
a. Construct a time series plot. What type of pattern exists in the data?b. Use trial and error to find a value of the exponential smoothing coefficient a thatresults in a relatively small MSE.c. Using the exponential smoothing model you developed in part b, what is the forecastof the percentage of stocks in a typical portfolio for the second quarter of year 3?
United Dairies, Inc., supplies milk to several independent grocers throughout DadeC ounty, Florida. Managers at United Dairies want to develop a forecast of the number ofhalf gallons of milk sold per week. Sales data for the past 12 weeks are:
a. Construct a time series plot. What type of pattern exists in the data?b. Use exponential smoothing with a 5 0.4 to develop a forecast of demand for week 13.What is the resulting MSE?
For the Hawkins Company, the monthly percentages of all shipments received on time over the past 12 months are 80, 82, 84, 83, 83, 84, 85, 84, 82, 83, 84, and 83.
a. Compute for a 3 month moving average forecast.
b. Compute for the exponential smoothing forecast for a=0.2.
c. Which provides the better forecast using MSE as the measure of model accuracy?
d. What is the forecast for next month?
Chapter 8 Solutions
Essentials of Business Analytics (MindTap Course List)
Ch. 8 - Consider the following time series data:
Using...Ch. 8 - Refer to the time series data in Problem 1. Using...Ch. 8 - Problems 1 and 2 used different forecasting...Ch. 8 - Consider the following time series data:
Compute...Ch. 8 - Consider the following time series...Ch. 8 - Consider the following time series...Ch. 8 - Refer to the gasoline sales time series data in...Ch. 8 - Prob. 8PCh. 8 - Prob. 9PCh. 8 - Prob. 10P
Ch. 8 - For the Hawkins Company, the monthly percentages...Ch. 8 - Corporate triple A bond interest rates for 12...Ch. 8 - The values of Alabama building contracts (in...Ch. 8 - The following time series shows the sales of a...Ch. 8 - Prob. 15PCh. 8 - The following table reports the percentage of...Ch. 8 - Consider the following time series: a. Construct a...Ch. 8 - Consider the following time series:
Construct a...Ch. 8 - Because of high tuition costs at state and private...Ch. 8 - The Seneca Children’s Fund (SCF) is a local...Ch. 8 - The president of a small manufacturing firm is...Ch. 8 - Consider the following time series: a. Construct a...Ch. 8 - Consider the following time series...Ch. 8 - The quarterly sales data (number of copies sold)...Ch. 8 - Prob. 25PCh. 8 - South Shore Construction builds permanent docks...Ch. 8 - Hogs & Dawgs is an ice cream parlor on the border...Ch. 8 - Donna Nickles manages a gasoline station on the...Ch. 8 - The Vintage Restaurant, on Captiva Island near...
Knowledge Booster


Learn more about
Need a deep-dive on the concept behind this application? Look no further. Learn more about this topic, statistics and related others by exploring similar questions and additional content below.Similar questions
- The US. import of wine (in hectoliters) for several years is given in Table 5. Determine whether the trend appearslinear. Ifso, and assuming the trend continues, in what year will imports exceed 12,000 hectoliters?arrow_forwardWhat does the y -intercept on the graph of a logistic equation correspond to for a population modeled by that equation?arrow_forwardCable TV The following table shows the number C. in millions, of basic subscribers to cable TV in the indicated year These data are from the Statistical Abstract of the United States. Year 1975 1980 1985 1990 1995 2000 C 9.8 17.5 35.4 50.5 60.6 60.6 a. Use regression to find a logistic model for these data. b. By what annual percentage would you expect the number of cable subscribers to grow in the absence of limiting factors? c. The estimated number of subscribers in 2005 was 65.3million. What light does this shed on the model you found in part a?arrow_forward
- The U.S. Census tracks the percentage of persons 25 years or older who are college graduates. That data forseveral years is given in Table 4[14]. Determine whether the trend appears linear. If so, and assuming the trendcontinues. in what year will the percentage exceed 35%?arrow_forwardDVD Player sales The table shows the number of DVD play-ers sold in a small electronics store in the years 2003-2013. What was the average rate of change of sales between 2003 and 2013? Whatwas the average rate of change of sales between 2003 and 2004? What was the average rate of change of sales between 2004 and 2005? Between which two successive years did DVD player sales increase most quickly?arrow_forwardLife Expectancy The following table shows the average life expectancy, in years, of a child born in the given year42 Life expectancy 2005 77.6 2007 78.1 2009 78.5 2011 78.7 2013 78.8 a. Find the equation of the regression line, and explain the meaning of its slope. b. Plot the data points and the regression line. c. Explain in practical terms the meaning of the slope of the regression line. d. Based on the trend of the regression line, what do you predict as the life expectancy of a child born in 2019? e. Based on the trend of the regression line, what do you predict as the life expectancy of a child born in 1580?2300arrow_forward
- Table 4 gives the population of a town (in thousand) from 2000 to 2008. What was the average rate of change of population (a) between 2002 and 2004, and (b) between 2002 and 2006?arrow_forwardFind the mean hourly cost when the cell phone described above is used for 240 minutes.arrow_forwardOlympic Pole Vault The graph in Figure 7 indicates that in recent years the winning Olympic men’s pole vault height has fallen below the value predicted by the regression line in Example 2. This might have occurred because when the pole vault was a new event there was much room for improvement in vaulters’ performances, whereas now even the best training can produce only incremental advances. Let’s see whether concentrating on more recent results gives a better predictor of future records. (a) Use the data in Table 2 (page 176) to complete the table of winning pole vault heights shown in the margin. (Note that we are using x=0 to correspond to the year 1972, where this restricted data set begins.) (b) Find the regression line for the data in part ‚(a). (c) Plot the data and the regression line on the same axes. Does the regression line seem to provide a good model for the data? (d) What does the regression line predict as the winning pole vault height for the 2012 Olympics? Compare this predicted value to the actual 2012 winning height of 5.97 m, as described on page 177. Has this new regression line provided a better prediction than the line in Example 2?arrow_forward
- Find the equation of the regression line for the following data set. x 1 2 3 y 0 3 4arrow_forwarda)Given the data 63, 64, 66, 67, 67, 69, 71, 72 are the units of actual sales of TV in the last eight periods. Find the forecast for the ninth period using simple exponential smoothing.Use α = 0.3 and initial forecast using simple average of last eight months. b)The sales of a company (in million dollars) for each year are shown in the table below. Find the linear sales trend line.x (year) 2005 2006 2007 2008 2009y (sales) 12 19 29 37 45 plz i need these answers within 4 hrs i need to submit them do the questions manually without using excel or minitabarrow_forwardThe quarterly sales of a company (in millions of dollars) over the past three years are given in the following table. Quarter 2007 2008 2009 Quarter 14 28 30 1 Quarter 2 Quarter 3 Quarter 4 20 16 36 40 10 14 18 38 12 b. a. Compute the four seasonal factors (Seasonal Indexes). Show all of your computations. The trend for these data is Trend = 20.82 +0.336 t (t represents time, where t-1 for Quarter 1 of 2007 and t-12 for Quarter 4 of 2009). Forecast sales for the first quarter of 2010 using the trend only. Show all of your computations. c. Forecast sales for the first quarter of 2010 using the trend and seasonal indexes and write your answer below. Show all of your computations.arrow_forward
arrow_back_ios
SEE MORE QUESTIONS
arrow_forward_ios
Recommended textbooks for you

 Algebra and Trigonometry (MindTap Course List)AlgebraISBN:9781305071742Author:James Stewart, Lothar Redlin, Saleem WatsonPublisher:Cengage Learning
 College AlgebraAlgebraISBN:9781305115545Author:James Stewart, Lothar Redlin, Saleem WatsonPublisher:Cengage Learning
 Glencoe Algebra 1, Student Edition, 9780079039897...AlgebraISBN:9780079039897Author:CarterPublisher:McGraw Hill
 Functions and Change: A Modeling Approach to Coll...AlgebraISBN:9781337111348Author:Bruce Crauder, Benny Evans, Alan NoellPublisher:Cengage Learning
 Big Ideas Math A Bridge To Success Algebra 1: Stu...AlgebraISBN:9781680331141Author:HOUGHTON MIFFLIN HARCOURTPublisher:Houghton Mifflin Harcourt
Algebra and Trigonometry (MindTap Course List)
Algebra
ISBN:9781305071742
Author:James Stewart, Lothar Redlin, Saleem Watson
Publisher:Cengage Learning
College Algebra
Algebra
ISBN:9781305115545
Author:James Stewart, Lothar Redlin, Saleem Watson
Publisher:Cengage Learning
Glencoe Algebra 1, Student Edition, 9780079039897...
Algebra
ISBN:9780079039897
Author:Carter
Publisher:McGraw Hill
Functions and Change: A Modeling Approach to Coll...
Algebra
ISBN:9781337111348
Author:Bruce Crauder, Benny Evans, Alan Noell
Publisher:Cengage Learning
Big Ideas Math A Bridge To Success Algebra 1: Stu...
Algebra
ISBN:9781680331141
Author:HOUGHTON MIFFLIN HARCOURT
Publisher:Houghton Mifflin Harcourt
Time Series Analysis Theory & Uni-variate Forecasting Techniques; Author: Analytics University;https://www.youtube.com/watch?v=_X5q9FYLGxM;License: Standard YouTube License, CC-BY
Operations management 101: Time-series, forecasting introduction; Author: Brandoz Foltz;https://www.youtube.com/watch?v=EaqZP36ool8;License: Standard YouTube License, CC-BY