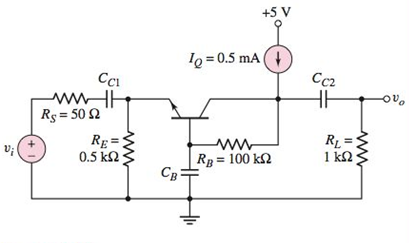
In the common−base circuit shown in Figure P7.70, the transistor parameters are:

Figure P7.70
(a)
The upper
Answer to Problem 7.70P
Explanation of Solution
Given:
The given circuit is shown below.

The transistor parameters
and
Calculation:
Transconductance
For Input Portion:
Time constant,
For Output portion:
Time constant,
(b)
The small signal mid- band voltage gain
Answer to Problem 7.70P
Explanation of Solution
Given:
The given circuit is shown below.

The transistor parameters
and
Calculation:
Transconductance
(c)
To identify: Whether the upper
Answer to Problem 7.70P
Yes, it is dominated by CL
Explanation of Solution
Given:
The given circuit is shown below.

The transistor parameters
and
Transconductance
Calculation:
For
Time constant,
Upper
Since
Want to see more full solutions like this?
Chapter 7 Solutions
Microelectronics: Circuit Analysis and Design
- The input reactance of an infinitesimal linear dipole of length 1/60 and radius a = x/200 is given by [In(/2a) - 11 X-120- tan(kl/2) Assuming the wire of the dipole is copper with a conductivity of 5.7 × 10'S/m. determine at f = 1 GHz the (a) loss resistance (b) radiation resistance (c) radiation efficiency input impedancearrow_forwardQ4- a) For the block diagram of control system shown below with its unit step response. Determine (K, a,damping ration, Maximum overshoot, Wn, Wd,ẞ, ts, tp, td, tr, and overall transfer function? C(1) ↑ 1.4 1.2 1 0.8 0.6 0.4 0.2 R(s) E(s) K C(s) $(s + α) 0.05 0.1 0.15 0.2 +2% -2%arrow_forwardDetermine the power radiated for the antenna has the following specifications (48 ohm radiation resistance, 2 ohm loss resistance and 50 ohms reactance) connected to generator with 12 V open circuit and internal impedance 50 ohm via à long transmission line with 100 ohm characteristic impedance.arrow_forward
- The former expert solved the question, but I didn't understand how he simplified the fractions. A communication satellite is in stationary (synchronous) orbit about the carch (assume altitude of 22.300 statute miles). Its transmitter generates 8.0 W. Assume the transmit- ting antenna is isotropic. Its signal is received by the 210-ft diameter tracking parabo- loidal antenna on the earth at the NASA tracking station at Goldstone, California. Also assume no resistive loss in either antenna, perfect polarization match, and perfect impedance match at both antennas. At a frequency of 2 GHz, determine the: (a) power density (in watts/m²) incident on the receiving antenna. (b) power received by the ground-based antenna whose gain is 60 dB.arrow_forwardDon't use ai to answer I will report you answerarrow_forwardA communication satellite is in stationary (synchronous) orbit about the earch (assume altitude of 22.300 statute miles). Its transmitter generates 8.0 W. Assume the transmit- ting antenna is isotropic. Its signal is received by the 210-ft diameter tracking parabo- loidal antenna on the earth at the NASA tracking station at Goldstone, California. Also assume no resistive loss in either antenna, perfect polarization match, and perfect impedance match at both antennas. At a frequency of 2 GHz. determine the: (a) power density (in watts/m²) incident on the receiving antenna. (b) power received by the ground-based antenna whose gain is 60 dB.arrow_forward
- Don't use ai to answer I will report you answerarrow_forwardA plane wave traveling in z-direction through a medium with &=8, μ-2 and has the electric and magnetic field intensity at z=0 shown in Fig. 6.1 and Fig. 6.2, respectively. Utilize the provided information to find the following: (a) w (b) The intrinsic impedance of the medium © B (d) a (e) The expression of the magnetic field intensity, H (f) The time-average power carried by the wave Magnetic Field Intensity (mA/m) Electric Field Intensity (V/m) 0.5 0.4- 0.3 0.2 ཧཱུྃ༔ཤྲུསྦྱ ཌུ ཋ ; སྟྲི " ° ཝཱ 0.1 -0.5 Ex -2.0 -1.5 -1.0 -0.5 0.0 0.5 1.0 1.5 Fig 6.2 Hy 2.0 Time (ns)². -2.0 -1.5 -1.0 -0.5 0.0; 0.5 1.0 Time (ns) 2.0 0.083 ns or 0.0415 Tarrow_forwardDon't use ai to answer I will report you answerarrow_forward
 Introductory Circuit Analysis (13th Edition)Electrical EngineeringISBN:9780133923605Author:Robert L. BoylestadPublisher:PEARSON
 Delmar's Standard Textbook Of ElectricityElectrical EngineeringISBN:9781337900348Author:Stephen L. HermanPublisher:Cengage Learning
 Programmable Logic ControllersElectrical EngineeringISBN:9780073373843Author:Frank D. PetruzellaPublisher:McGraw-Hill Education
 Fundamentals of Electric CircuitsElectrical EngineeringISBN:9780078028229Author:Charles K Alexander, Matthew SadikuPublisher:McGraw-Hill Education
 Electric Circuits. (11th Edition)Electrical EngineeringISBN:9780134746968Author:James W. Nilsson, Susan RiedelPublisher:PEARSON
 Engineering ElectromagneticsElectrical EngineeringISBN:9780078028151Author:Hayt, William H. (william Hart), Jr, BUCK, John A.Publisher:Mcgraw-hill Education,


