
(a)
All of the constants in the equation fir tensile yield strength as function of solid solution composition.
(a)
Answer to Problem 7.6P
The constants in the equation fir tensile yield strength as function of solid solution composition is
Explanation of Solution
Concept used:
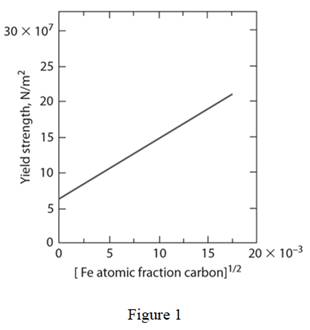
Draw the diagram for yield strength of iron as a function of the atom fraction of carbon to the one-half power as shown below:
Write the expression for tensile strength of solid solution strengthened alloy.
Here,
Calculation:
Refer to figure 1; the value of
Refer to figure 1; at atom fraction of carbon as
Substitute
Conclusion:
Thus, the constants in the equation fir tensile yield strength as function of solid solution composition is
(b)
The yield strength of iron-carbon alloy.
(b)
Answer to Problem 7.6P
The yield strength of iron-carbon alloyis
Explanation of Solution
Substitute
Conclusion:
Thus, the yield strength of iron-carbon alloyis
(c)
Comment if fraction of carbon increased thenthe strength to be given by an extension of the line in the figure or not.
(c)
Explanation of Solution
If the concentration of solid solution atoms becomes large then the precipitation of atoms starts to form. As mentioned if concentration is increased from
The strength dependence of precipitates is different than the strength dependence of solid solution. Therefore, it is not possible to give extension of line in figure.
Want to see more full solutions like this?
Chapter 7 Solutions
Materials Science And Engineering Properties

- Problem 4 (A, B, E, D and F are all pin connected and C is fixed) Find the reactions at A, D and F 8 m B 6m E 12 kN D F 4 marrow_forwardProblem 1 (A, C and D are pins) Find the reactions and A, C and D. D 6 m B 12 kN/m 8 m A C 6 marrow_forwardUniform Grade of Pipe Station of Point A is 9+50.00. Elevation Point A = 250.75.Station of Point B is 13+75.00. Elevation Point B = 244.10 1) Calculate flowline of pipe elevations at every 50 ft. interval (Half Station). 2) Tabulate station and elevation for each station like shown on example 3) Draw Sketcharrow_forward
- quantity surveyingarrow_forwardNote: Please accurately answer it!. I'll give it a thumbs up or down based on the answer quality and precision. Question: What is the group name of Sample B in problem 3 from the image?. By also using the ASTM flow chart!. This unit is soil mechanics btwarrow_forwardPick the rural location of a project site in Victoria, and its catchment area-not bigger than 25 sqkm, and given the below information, determine the rainfall intensity for ARI = 5, 50, 100 year storm event. Show all the details of the procedure. Each student must propose different length of streams and elevations. Use fig below as a sample only. Pt. E-ht. 95.0 200m 600m PLD-M. 91.0 300m Pt. C-93.0 300m PL.B-ht. 92.0 PL.F-ht. 96.0 500m Pt. A-M. 91.00 To be deemed satisfactory the solution must include: Q.F1.1.Choice of catchment location Q.F1.2. A sketch displaying length of stream and elevation Q.F1.3. Catchment's IFD obtained from the Buro of Metheorology for specified ARI Q.F1.4.Calculation of the time of concentration-this must include a detailed determination of the equivalent slope. Q.F1.5.Use must be made of the Bransby-Williams method for the determination of the equivalent slope. Q.F1.6.The graphical display of the estimation of intensities for ARI 5,50, 100 must be shown.arrow_forward
- QUANTITY SURVEYINGarrow_forward3. (a) Use method of joints to determine forces in all members (all distances are in mm) (b) Find the resultant force at the pin support and state its angle of inclination FIGURE 2 2400 3.3 kN 6 3.6 ky 12 2 + 2400 0.7 kN + 2400 3.3kN + 2400arrow_forwardOK i need help. Please help me work thorought this with autocad. I am not sure where to begin but i need to draw this. Well if you read the question we did it in class and I got suepr confsued.arrow_forward
 Materials Science And Engineering PropertiesCivil EngineeringISBN:9781111988609Author:Charles GilmorePublisher:Cengage Learning