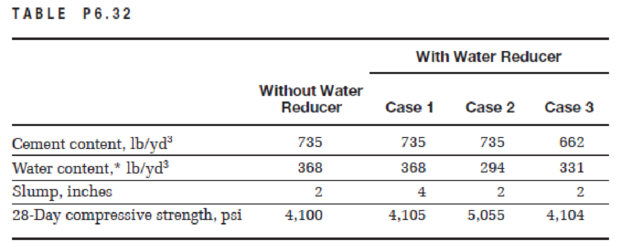
The results of an experiment to evaluate the effects of a water reducer are shown in Table P6.32.
a. Calculate the water–cement ratio in each of the three cases.
b. Using water reducer, how can we increase the compressive strength of concrete without changing workability? Refer to the appropriate case in the table.
c. Using water reducer, how can we improve workability without changing the compressive strength? Refer to the appropriate case in the table.
d. Using water reducer, how can we reduce cost without changing workability or strength? (Assume that the cost of the small amount of water reducer added is less than the cost of cement.) Refer to the appropriate case in the table.
e. Summarize all possible effects of water reducers on concrete.

*Assume that the water content is above the saturated surface-dry (SSD) condition of the aggregate.
Learn your wayIncludes step-by-step video

Chapter 6 Solutions
Materials for Civil and Construction Engineers (4th Edition)
Additional Engineering Textbook Solutions
Elementary Surveying: An Introduction To Geomatics (15th Edition)
Foundation Design: Principles and Practices (3rd Edition)
Structural Analysis (10th Edition)
Elementary Surveying (14th Edition)
Modern Database Management
Computer Science: An Overview (13th Edition) (What's New in Computer Science)
- Please provide complete solution.arrow_forward6.31 The results of a laboratory experiment to evaluate the effects of a plasticizer are shown below. a. Calculate the water/cement in each of the three cases. b. Using water reducer, how can we increase the compressive strength of con- crete without changing workability? Refer to the appropriate case in the table. 244 Chapter 6 Portland Cement, Mixing Water, and Admixtures With Water Reducer Without Water Reducer Case 1 Case 2 Case 3 Cement Content, kg/m 850 850 850 765 Water Content, kg/m Slump, mm Compressive Strength, MPa 465 465 370 419 50 100 50 50 37.8 38.0 46 37.9 c. Using water reducer, how can we improve workability without channging the compressive strength? Refer to the appropriate case in the table. d. Using water reducer, how can we reduce cost without changing workability or strength? (Assume that the cost of the small amount of water reducer added is less than the cost of cement.) Refer to the appropriate case in the table. Summarize all possible effects of water…arrow_forwardA concrete mix includes the following ingredients per cubic meter: a. Cement = 400 kg b. Water = 176 kg c. No admixture Table P6.30 shows possible changes that can be made to the mix ingredi- ents. Indicate in the appropriate boxes in the table what will happen in each case for the workability and the ultimate compressive strength as increase, decrease, or approximately the same.arrow_forward
- ANSWER C D Earrow_forward6. Discuss the different types of volume change in concrete at early and long-term ages.arrow_forward150 mm * 300 mm concrete cylinders were made of the same batch and separated at random to six equal groups. The six groups of cylinders were submerged in water for different times before testing for compressive strength and the results are shown in Table .It is required to do the following:a. Determine the compressive strength at different curing times.b. Using an Excel sheet, plot the relationship between curing time and compressive strength. Label all axes and curves.c. Comment on the effect of curing time on the compressive strength.d. What is the approximate ratio between the compressive strengths at 7 days and 28 days?e. What is the approximate ratio between the compressive strengths at 28 days and 180 days?arrow_forward
- Problem 2: If f = 3 ksi what is the modulus of elasticity Ec and the maximum tensile stress fr that the concrete can carry before cracking (use ACI recommended equations). Assume a unit weight of the plain concrete is: a. Wc = 90- b. w lb lb 118- ft39 ft3) C. W = 160- Problem 3: Wight 3-6 Rugblom 4: Wight ? 7 lb ft3arrow_forwardUsing Figure a. Determine the ultimate stress at each water–cement ratio.b. Determine the secant modulus at 40% of the ultimate stress at each water–cement ratio.c. Plot the relationship between the secant moduli and the ultimate stresses.d. Plot the relationship between the moduli and the ultimate stresses on the same graph of part (c), using the relation of the ACI Building Code.e. Compare the two relations in questions c and d and comment on any discrepancies.f. Determine the toughness at each water–cement ratio and comment on the effect of increasing water–cement ratio on the toughness of concrete.arrow_forwardA concrete mix includes the following ingredients per cubic meter: Cement%3D400 kg Water=184 kg No admixture Table below shows possible alternatives mix ingredients. Indicate in the appropriate boxes in the table what will happen in each case for the workability and the ultimate compressive strength as increase, decrease or approximately the same. What will happen? Cement Water Admixture (kg) (kg) Ultimate compressive Workability strength 400 225 None 449 184 None Water 400 184 Reducer Water 400 128 Reducer 400 184 Super Plasticizer 400 184 Air Entrainer 400 184 Accelerator DFocusarrow_forward
- 150 mm * 300 mm concrete cylinders were made of the same batch and sepa- rated at random to six equal groups. The six groups of cylinders were sub- merged in water for different times before testing for compressive strength and the results are shown in Table P7.39. It is required to do the following: a. Determine the compressive strength at different curing times. b. Using an Excel sheet, plot the relationship between curing time and compressive strength. Label all axes and curves. c. Comment on the effect of curing time on the compressive strength. d. What is the approximate ratio between the compressive strengths at 7 days and 28 days? e. What is the approximate ratio between the compressive strengths at 28 days and 180 days?arrow_forwardCorrectly define which of the stress versus strain graphs represent the comparison of 8 ksi and 4 ksi concrete for the chart below (say left or right). Qualitatively compare the w/c ratio, elastic modulus, and brittleness. 0.000 0.003 0.000 0.003 Sean, e Sane Feure 2 Strss vesus Srain curves Feure 2. Stress vasus rain curvearrow_forward5 - please show correct and complete solution, thanks!arrow_forward

 Structural Analysis (10th Edition)Civil EngineeringISBN:9780134610672Author:Russell C. HibbelerPublisher:PEARSON
 Principles of Foundation Engineering (MindTap Cou...Civil EngineeringISBN:9781337705028Author:Braja M. Das, Nagaratnam SivakuganPublisher:Cengage Learning
 Fundamentals of Structural AnalysisCivil EngineeringISBN:9780073398006Author:Kenneth M. Leet Emeritus, Chia-Ming Uang, Joel LanningPublisher:McGraw-Hill Education
 Traffic and Highway EngineeringCivil EngineeringISBN:9781305156241Author:Garber, Nicholas J.Publisher:Cengage Learning


