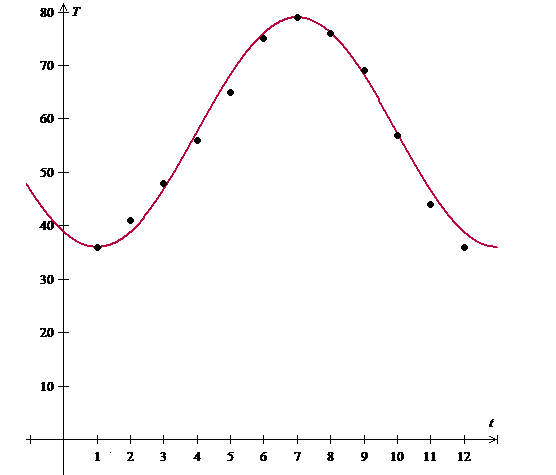
To graph: Find sinusoidal function and graph function with
Model the temperature T as a sinusoidal function of time, using 34 as the minimum value
and 79 as the maximum value. The average monthly Fahrenheit temperatures in Albuquerque, New Mexico, for 2012 are shown in the table ( , etc.):
| Month | 1 | 2 | 3 | 4 | 5 | 6 | 7 | 8 | 9 | 10 | 11 | 12 |
| Temp | 34 | 40 | 47 | 55 | 64 | 74 | 79 | 76 | 69 | 57 | 44 | 35 |
Given information
The given table
| Month | 1 | 2 | 3 | 4 | 5 | 6 | 7 | 8 | 9 | 10 | 11 | 12 |
| Temp | 34 | 40 | 47 | 55 | 64 | 74 | 79 | 76 | 69 | 57 | 44 | 35 |
Graph:
Consider the given information.
Choose cosine function.
Where
Maximum T is 79 and minimum is 36.
So,
Hence, amplitude is 21.5.
Vertical shift is
Period of the function is 12 months.
Since, it is cosine function, so maximum should at t = 0 but this data is maximum at t = 7, So phase shift is
Now apply the formula
Now draw function on the scatter plot.
To plot the scatter plot of T as a function of t take t on the x − axis and T on the y −axis and plot ordered pairs like

Chapter 4 Solutions
PRECALCULUS:GRAPHICAL,...-NASTA ED.
- Which sign makes the statement true? 9.4 × 10² 9.4 × 101arrow_forwardDO these math problems without ai, show the solutions as well. and how you solved it. and could you do it with in the time spandarrow_forwardThe Cartesian coordinates of a point are given. (a) (-8, 8) (i) Find polar coordinates (r, 0) of the point, where r > 0 and 0 ≤ 0 0 and 0 ≤ 0 < 2π. (1, 0) = (r. = ([ (ii) Find polar coordinates (r, 8) of the point, where r < 0 and 0 ≤ 0 < 2π. (5, 6) = =([arrow_forward
- The Cartesian coordinates of a point are given. (a) (4,-4) (i) Find polar coordinates (r, e) of the point, where r > 0 and 0 0 and 0 < 0 < 2π. (r, 6) = X 7 (ii) Find polar coordinates (r, 8) of the point, where r < 0 and 0 0 < 2π. (r, 0) = Xarrow_forwardr>0 (r, 0) = T 0 and one with r 0 2 (c) (9,-17) 3 (r, 8) (r, 8) r> 0 r<0 (r, 0) = (r, 8) = X X X x x Warrow_forward74. Geometry of implicit differentiation Suppose x and y are related 0. Interpret the solution of this equa- by the equation F(x, y) = tion as the set of points (x, y) that lie on the intersection of the F(x, y) with the xy-plane (z = 0). surface Z = a. Make a sketch of a surface and its intersection with the xy-plane. Give a geometric interpretation of the result that dy dx = Fx F χ y b. Explain geometrically what happens at points where F = 0. yarrow_forward
- Example 3.2. Solve the following boundary value problem by ADM (Adomian decomposition) method with the boundary conditions მი მი z- = 2x²+3 дг Əz w(x, 0) = x² - 3x, θω (x, 0) = i(2x+3). ayarrow_forward6. A particle moves according to a law of motion s(t) = t3-12t2 + 36t, where t is measured in seconds and s is in feet. (a) What is the velocity at time t? (b) What is the velocity after 3 s? (c) When is the particle at rest? (d) When is the particle moving in the positive direction? (e) What is the acceleration at time t? (f) What is the acceleration after 3 s?arrow_forwardConstruct a table and find the indicated limit. √√x+2 If h(x) = then find lim h(x). X-8 X-8 Complete the table below. X 7.9 h(x) 7.99 7.999 8.001 8.01 8.1 (Type integers or decimals rounded to four decimal places as needed.)arrow_forward
 Calculus: Early TranscendentalsCalculusISBN:9781285741550Author:James StewartPublisher:Cengage Learning
 Thomas' Calculus (14th Edition)CalculusISBN:9780134438986Author:Joel R. Hass, Christopher E. Heil, Maurice D. WeirPublisher:PEARSON
 Calculus: Early Transcendentals (3rd Edition)CalculusISBN:9780134763644Author:William L. Briggs, Lyle Cochran, Bernard Gillett, Eric SchulzPublisher:PEARSON
 Calculus: Early TranscendentalsCalculusISBN:9781319050740Author:Jon Rogawski, Colin Adams, Robert FranzosaPublisher:W. H. Freeman
 Calculus: Early Transcendental FunctionsCalculusISBN:9781337552516Author:Ron Larson, Bruce H. EdwardsPublisher:Cengage Learning


