
a.
The month in which the shop first began to make money.
The month in which the shop first began to make money is March
Given:
Given, owing to startup costs and seasonal variations, Gina found that the monthly profit in her bagel shop during the first year followed an up-and-down pattern that could be modeled by
Calculation:
For the shop to make profit,
Graphing the function:
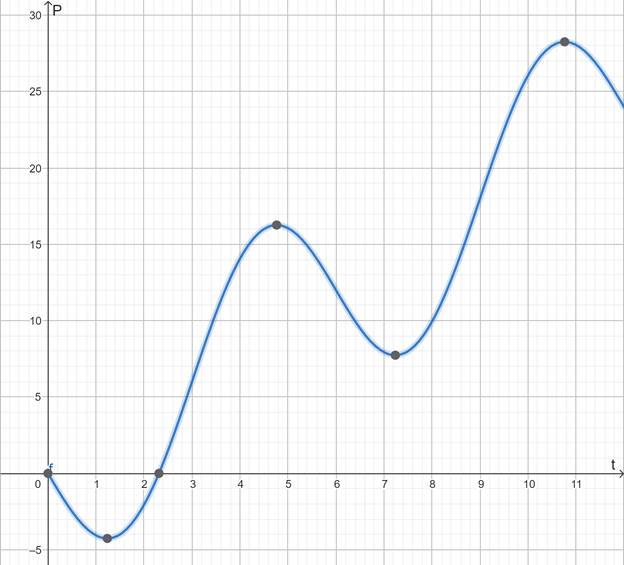
From the graph, it is seen that the shop starts making Profit between 2 and 3 i.e., in March.
Conclusion:
The month in which the shop first began to make money is March
b.
The month in which the shop enjoyed its greatest profit in that first year.
The month in which the shop enjoyed its greatest profit in that first year is November.
Given:
Given, owing to startup costs and seasonal variations, Gina found that the monthly profit in her bagel shop during the first year followed an up-and-down pattern that could be modeled by
Calculation:
Graphing the function:

From the graph, in the first year i.e., between 0 and 12, the highest profit is made between 10 and 11. So the highest profit is made in November.
Conclusion:
The month in which the shop enjoyed its greatest profit in that first year is November.
Chapter 4 Solutions
PRECALCULUS:GRAPHICAL,...-NASTA ED.

- Consider the function f(x) = x²-1. (a) Find the instantaneous rate of change of f(x) at x=1 using the definition of the derivative. Show all your steps clearly. (b) Sketch the graph of f(x) around x = 1. Draw the secant line passing through the points on the graph where x 1 and x-> 1+h (for a small positive value of h, illustrate conceptually). Then, draw the tangent line to the graph at x=1. Explain how the slope of the tangent line relates to the value you found in part (a). (c) In a few sentences, explain what the instantaneous rate of change of f(x) at x = 1 represents in the context of the graph of f(x). How does the rate of change of this function vary at different points?arrow_forward1. The graph of ƒ is given. Use the graph to evaluate each of the following values. If a value does not exist, state that fact. и (a) f'(-5) (b) f'(-3) (c) f'(0) (d) f'(5) 2. Find an equation of the tangent line to the graph of y = g(x) at x = 5 if g(5) = −3 and g'(5) = 4. - 3. If an equation of the tangent line to the graph of y = f(x) at the point where x 2 is y = 4x — 5, find ƒ(2) and f'(2).arrow_forwardDoes the series converge or divergearrow_forward
- Suppose that a particle moves along a straight line with velocity v (t) = 62t, where 0 < t <3 (v(t) in meters per second, t in seconds). Find the displacement d (t) at time t and the displacement up to t = 3. d(t) ds = ["v (s) da = { The displacement up to t = 3 is d(3)- meters.arrow_forwardLet f (x) = x², a 3, and b = = 4. Answer exactly. a. Find the average value fave of f between a and b. fave b. Find a point c where f (c) = fave. Enter only one of the possible values for c. c=arrow_forwardplease do Q3arrow_forward
- Use the properties of logarithms, given that In(2) = 0.6931 and In(3) = 1.0986, to approximate the logarithm. Use a calculator to confirm your approximations. (Round your answers to four decimal places.) (a) In(0.75) (b) In(24) (c) In(18) 1 (d) In ≈ 2 72arrow_forwardFind the indefinite integral. (Remember the constant of integration.) √tan(8x) tan(8x) sec²(8x) dxarrow_forwardFind the indefinite integral by making a change of variables. (Remember the constant of integration.) √(x+4) 4)√6-x dxarrow_forward
 Calculus: Early TranscendentalsCalculusISBN:9781285741550Author:James StewartPublisher:Cengage Learning
 Thomas' Calculus (14th Edition)CalculusISBN:9780134438986Author:Joel R. Hass, Christopher E. Heil, Maurice D. WeirPublisher:PEARSON
 Calculus: Early Transcendentals (3rd Edition)CalculusISBN:9780134763644Author:William L. Briggs, Lyle Cochran, Bernard Gillett, Eric SchulzPublisher:PEARSON
 Calculus: Early TranscendentalsCalculusISBN:9781319050740Author:Jon Rogawski, Colin Adams, Robert FranzosaPublisher:W. H. Freeman
 Calculus: Early Transcendental FunctionsCalculusISBN:9781337552516Author:Ron Larson, Bruce H. EdwardsPublisher:Cengage Learning