
Videos
Lenovo uses the ZX-81 chip in some of its laptop computers. The prices for the chip during the past 12 months were as follows:

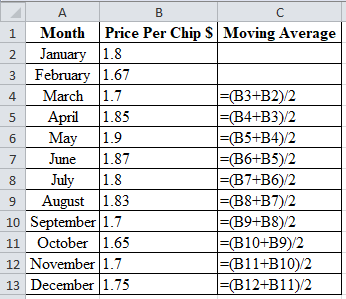
a) Use a 2-month moving average on all the data and plot the averages and the prices.
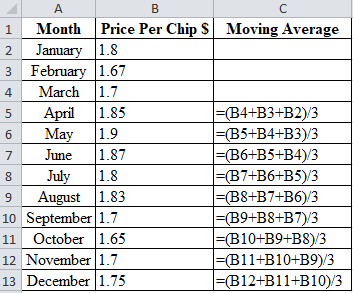
b) Use a 3-month moving average and add the 3-month plot to the graph created in part (a).
c) Which is better (using the mean absolute deviation): the 2-month average or the 3-month average?
d) Compute the
a)
To determine:Plot and graphically represent the averages and the prices using 2-month moving average.
Introduction: Forecasting is used to predict future changes or a demand pattern. It involves different approaches and varies with different time periods. Moving average, weighted moving average and exponential smoothing are the time series methods of forecasting which uses past data to forecast the future.
Answer to Problem 9P
By using 2-month moving average, the averages and the prices are plotted.
Explanation of Solution
Given information:
| Month | Price Per Chip |
| January | 1.80 |
| February | 1.67 |
| March | 1.70 |
| April | 1.85 |
| May | 1.90 |
| June | 1.87 |
| July | 1.80 |
| August | 1.83 |
| September | 1.70 |
| October | 1.65 |
| November | 1.70 |
| December | 1.75 |
Formula to calculate the forecasted demand
| Month | Price Per Chip $ | Moving Average |
| January | 1.8 | |
| February | 1.67 | |
| March | 1.7 | 1.735 |
| April | 1.85 | 1.685 |
| May | 1.9 | 1.775 |
| June | 1.87 | 1.875 |
| July | 1.8 | 1.885 |
| August | 1.83 | 1.835 |
| September | 1.7 | 1.815 |
| October | 1.65 | 1.765 |
| November | 1.7 | 1.675 |
| December | 1.75 | 1.675 |
Table 1
Excel worksheet:
Calculation of the forecast for March:
To calculate the forecast for March, divide the summation of the values of January and February by 2. The corresponding value 1.735 is the forecast for March. The 2-month moving average for the month of March is 1.735.
Calculation of the forecast for April:
To calculate the forecast for April, divide the summation of the values of February and March by 2. The corresponding value 1.685 is the forecast for April. The 2-month moving average for the month of April is 1.685.
Calculation of the forecast for May:
To calculate the forecast for May, divide the summation of the values of March and April by 2. The corresponding value 1.775 is the forecast for May. The 2-month moving average for the month of May is 1.775.
Calculation of the forecast for June:
To calculate the forecast for June, divide the summation of the values of April and May by 2. The corresponding value 1.875 is the forecast for June. The 2-month moving average for the month of June is 1.875.
Calculation of the forecast for July:
To calculate the forecast for July, divide the summation of the values of May and June by 2. The corresponding value 1.885 is the forecast for July. The 2-month moving average for the month of July is 1.885
Calculation of the forecast for August:
To calculate the forecast for August, divide the summation of the values of June and July by 2. The corresponding value 1.835 is the forecast for August. The 2-month moving average for the month of August is 1.685.
Calculation of the forecast for September:
To calculate the forecast for September, divide the summation of the values of July and August by 2. The corresponding value 1.815 is the forecast for September. The 2-month moving average for the month of September is 1.815.
Calculation of the forecast for October:
To calculate the forecast for October, divide the summation of the values of August and September by 2. The corresponding value 1.765 is the forecast for October. The 2-month moving average for the month of October is 1.765.
Calculation of the forecast for November:
To calculate the forecast for November, divide the summation of the values of September and October by 2. The corresponding value 1.675 is the forecast for November. The 2-month moving average for the month of November is 1.675.
Calculation of the forecast for December:
To calculate the forecast for December, divide the summation of the values of October and November by 2. The corresponding value 1.675 is the forecast for December. The 2-month moving average for the month of December is 1.675.
Graph:
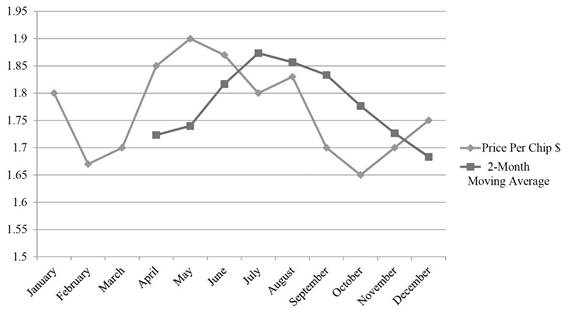
The data for 2-month moving average is obtained from Table 1. Graph is plotted with price per chip, and 2-month moving average.
Hence, the graphical representation of the averages and the prices are plotted using 2-month moving average.
b)
To determine:Plot and graphically represent the averages and the prices using 3-month moving average.
Answer to Problem 9P
By using 3-month moving average, the averages and the prices are plotted.
Explanation of Solution
Given information:
| Month | Price Per Chip |
| January | 1.80 |
| February | 1.67 |
| March | 1.70 |
| April | 1.85 |
| May | 1.90 |
| June | 1.87 |
| July | 1.80 |
| August | 1.83 |
| September | 1.70 |
| October | 1.65 |
| November | 1.70 |
| December | 1.75 |
Formula to calculate the forecasted demand:
| Month | Price Per Chip $ | Moving Average |
| January | 1.8 | |
| February | 1.67 | |
| March | 1.7 | |
| April | 1.85 | 1.723 |
| May | 1.9 | 1.740 |
| June | 1.87 | 1.817 |
| July | 1.8 | 1.873 |
| August | 1.83 | 1.857 |
| September | 1.7 | 1.833 |
| October | 1.65 | 1.777 |
| November | 1.7 | 1.727 |
| December | 1.75 | 1.683 |
Table 2
Excel worksheet:
Calculation of the forecast for April:
To calculate the forecast for April, divide the summation of the values of January, February and March by 3. The corresponding value 1.732 is the forecast for April. Therefore, 3-month moving average for the month of April is 1.723.
Calculation of the forecast for May:
To calculate the forecast for May, divide the summation of the values of February, March and April by 3. The corresponding value 1.740 is the forecast for May. Therefore, 3-month moving average for the month of May is 1.740.
Calculation of the forecast for June:
To calculate the forecast for June, divide the summation of the values of March, April and May by 3. The corresponding value 1.817 is the forecast for June. Therefore, 3-month moving average for the month of June is 1.817.
Calculation of the forecast for July:
To calculate the forecast for July, divide the summation of the values of April, May and June by 3. The corresponding value 1.873 is the forecast for July. Therefore, 3-month moving average for the month of July is 1.873.
Calculation of the forecast for August:
To calculate the forecast for August, divide the summation of the values of May, June and July by 3. The corresponding value 1.873 is the forecast for August. Therefore, 3-month moving average for the month of August is 1.873.
Calculation of the forecast for September:
To calculate the forecast for September, divide the summation of the values of June, July and August by 3. The corresponding value 1.833 is the forecast for September. Therefore, 3-month moving average for the month of June is 1.833.
Calculation of the forecast for October:
To calculate the forecast for October, divide the summation of the values of July, August and September by 3. The corresponding value 1.777 is the forecast for October. Therefore, 3-month moving average for the month of June is 1.777.
Calculation of the forecast for November:
To calculate the forecast for November, divide the summation of the values of August, September and October by 3. The corresponding value 1.727 is the forecast for November. Therefore, 3-month moving average for the month of November is 1.727.
Calculation of the forecast for December:
To calculate the forecast for December, divide the summation of the values of September, October and November by 3. The corresponding value 1.683 is the forecast for December. Therefore, 3-month moving average for the month of December is 1.683.
Graph:
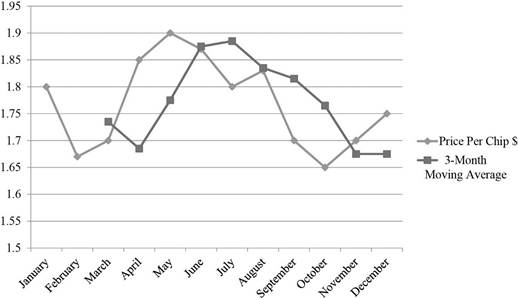
The data for 3-month moving average is obtained from Table 2. Graph is plotted with price per chip, and 3-month moving average.
Hence, the graphical representation of the averages and the prices are plotted using 3-month moving average.
c)
To determine:Compute the Mean Absolute Deviation (MAD) using 2-month moving average and 3-month moving average and from the results, infer the superior method.
Answer to Problem 9P
MAD from 2-month moving average and 3-month moving average are 0.075 & 0.079 (refer to equations (1) & (2)). Because of less deviation of error, MAD from a 2-month moving average is superior over a 3-month moving average.
Explanation of Solution
Given information:
| Month | Price Per Chip |
| January | 1.80 |
| February | 1.67 |
| March | 1.70 |
| April | 1.85 |
| May | 1.90 |
| June | 1.87 |
| July | 1.80 |
| August | 1.83 |
| September | 1.70 |
| October | 1.65 |
| November | 1.70 |
| December | 1.75 |
Formula to calculate MAD:
Calculation of MAD using 2-month moving average:
Table 1 provides the calculation of forecast using 2-month moving average.
| Month | Price Per Chip $ | 2-month moving average | Absolute error |
| January | 1.8 | ||
| February | 1.67 | ||
| March | 1.7 | 1.735 | 0.035 |
| April | 1.85 | 1.685 | 0.165 |
| May | 1.9 | 1.775 | 0.125 |
| June | 1.87 | 1.875 | 0.005 |
| July | 1.8 | 1.885 | 0.085 |
| August | 1.83 | 1.835 | 0.005 |
| September | 1.7 | 1.815 | 0.115 |
| October | 1.65 | 1.765 | 0.115 |
| November | 1.7 | 1.675 | 0.025 |
| December | 1.75 | 1.675 | 0.075 |
| Total | 0.75 | ||
| MAD | 0.075 |
Excel worksheet:
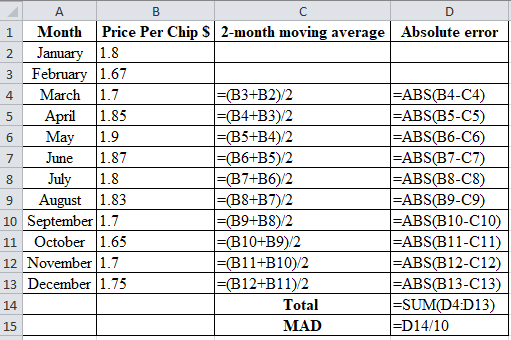
Calculation of the absolute error for March:
Absolute Error of March is the modulus of the difference between 1.7 and 1.735, which corresponds to 0.035. Therefore Absolute Error for March is 0.035.
Calculation of the absolute error for April:
Absolute Error of April is the modulus of the difference between 1.85 and 1.685, which corresponds to 0.165. Therefore Absolute Error for April is 0.165.
Calculation of the absolute error for May:
Absolute Error of May is the modulus of the difference between 1.9 and 1.775, which corresponds to 0.125. Therefore Absolute Error for May is 0.125.
Calculation of the absolute error for June:
Absolute Error of June is the modulus of the difference between 1.87 and 1.875, which corresponds to 0.005. Therefore Absolute Error for June is 0.005.
Calculation of the absolute error for July:
Absolute Error of July is the modulus of the difference between 1.8 and 1.885, which corresponds to 0.085. Therefore Absolute Error for July is 0.085.
Calculation of the absolute error for August:
Absolute Error of August is the modulus of the difference between 1.83 and 1.835, which corresponds to 0.005. Therefore Absolute Error for August is 0.005.
Calculation of the absolute error for September:
Absolute Error of September is the modulus of the difference between 1.7 and 1.815, which corresponds to 0.115. Therefore Absolute Error for September is 0.115.
Calculation of the absolute error for October:
Absolute Error of October is the modulus of the difference between 1.65 and 1.765, which corresponds to 0.115. Therefore Absolute Error for October is 0.115.
Calculation of the absolute error for November:
Absolute Error of November is the modulus of the difference between 1.7 and 1.675, which corresponds to 0.025. Therefore Absolute Error for November is 0.025.
Calculation of the absolute error for December:
Absolute Error of December is the modulus of the difference between 1.75 and 1.675, which corresponds to 0.075. Therefore Absolute Error for December is 0.075.
Calculation of MAD using 2-month moving average:
Mean Absolute Deviation is obtained by dividing the summation of absolute values by the number of years. Absolute error is obtained by taking modulus for the difference between Actual and forecasted values.
Substitute the summation value of absolute error for 10 years i.e. 0.75 is divided by number of years i.e. 10 yields MAD of 0.075
The Mean Absolute Deviation using 2-month moving average is 0.075
Calculation of MAD using 3-month moving average
Table 2 provides the value of 3-month moving average
| Month | Price Per Chip $ | 3-month Moving Average | Absolute error |
| January | 1.8 | ||
| February | 1.67 | ||
| March | 1.7 | ||
| April | 1.85 | 1.723 | 0.127 |
| May | 1.9 | 1.740 | 0.160 |
| June | 1.87 | 1.817 | 0.053 |
| July | 1.8 | 1.873 | 0.073 |
| August | 1.83 | 1.857 | 0.027 |
| September | 1.7 | 1.833 | 0.133 |
| October | 1.65 | 1.777 | 0.127 |
| November | 1.7 | 1.727 | 0.027 |
| December | 1.75 | 1.683 | 0.067 |
| Total | 0.793 | ||
| MAD | 0.079 |
Excel worksheet:
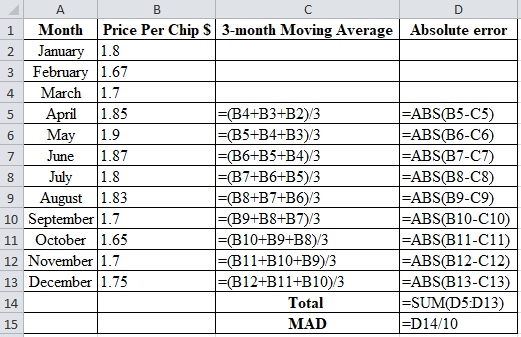
Calculation of the Absolute Error for April:
Absolute Error of April is the modulus of the difference between 1.85 and 1.723, which corresponds to 0.127. Absolute Error for April is 0.127
Calculation of the Absolute Error for May:
Absolute Error of May is the modulus of the difference between 1.9 and 1.740, which corresponds to 0.160. Therefore Absolute Error for May is 0.160
Calculation of the Absolute Error for June:
Absolute Error of June is the modulus of the difference between 1.87 and 1.817, which corresponds to 0.053. Therefore Absolute Error for June is 0.053
Calculation of the Absolute Error for July:
Absolute Error of July is the modulus of the difference between 1.8 and 1.873, which corresponds to 0.073. Absolute Error for July is 0.073.
Calculation of the Absolute Error for August:
Absolute Error of August is the modulus of the difference between 1.83 and 1.857, which corresponds to 0.027. Therefore, Absolute Error for August is 0.027.
Calculation of the Absolute Error for September:
Absolute Error of September is the modulus of the difference between 1.7 and 1.833, which corresponds to 0.133. Therefore Absolute Error for September is 0.133.
Calculation of the Absolute Error for October:
Absolute Error of October is the modulus of the difference between 1.65 and 1.777, which corresponds to 0.127. Therefore Absolute Error for October is 0.127.
Calculation of the Absolute Error for November:
Absolute Error of November is the modulus of the difference between 1.7 and 1.727, which corresponds to 0.027. Therefore Absolute Error for November is 0.027
Calculation of the Absolute Error for December:
Absolute Error of December is the modulus of the difference between 1.75 and 1.683, which corresponds to 0.067. Therefore Absolute Error for December is 0.067
Calculation of MAD using 3-month moving average:
Substitute the summation value of absolute error for 10 years i.e. 0.793 is divided by number of years i.e. 9 yields MAD of 0.079. Mean Absolute Deviation using 3-month moving average is 0.079
Hence, the Mean Absolute Deviation from the 2-month moving average is 0.075 (refer to equation (1)) and from the 3-month moving average is 0.079 (refer to equation (2)). Due to less deviation of error, the MAD from the 2-month moving average is superior to that of the 3-month moving average.
d)
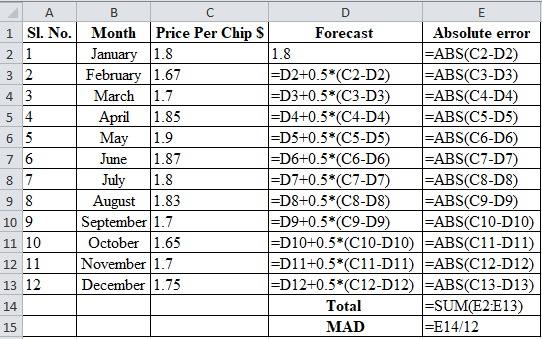
To determine: Decide the best method by computing Mean Absolute Duration using exponential smoothing with α = 0.1, α = 0.3 and α = 0.5
Answer to Problem 9P
The Mean Absolute Deviation using exponential smoothing using α = 0.1 is 0.071, (refer to equation 3), α = 0.3 is 0.070 (refer to equation 4) and α = 0.5 is 0.066 (refer to equation 5). MAD using α = 0.5 is the best method since the MAD is minimum.
Explanation of Solution
Given information:
| Month | Price Per Chip |
| January | 1.80 |
| February | 1.67 |
| March | 1.70 |
| April | 1.85 |
| May | 1.90 |
| June | 1.87 |
| July | 1.80 |
| August | 1.83 |
| September | 1.70 |
| October | 1.65 |
| November | 1.70 |
| December | 1.75 |
The initial forecast for the month of January is $1.80
Formula to calculate the forecasted demand
Where,
Calculation of MAD using exponential smoothing with smoothing constant α = 0.1
| Sl. No. | Month | Price Per Chip $ | Forecast | Absolute error |
| 1 | January | 1.8 | 1.8 | 0 |
| 2 | February | 1.67 | 1.8 | 0.130 |
| 3 | March | 1.7 | 1.787 | 0.087 |
| 4 | April | 1.85 | 1.778 | 0.072 |
| 5 | May | 1.9 | 1.785 | 0.115 |
| 6 | June | 1.87 | 1.797 | 0.073 |
| 7 | July | 1.8 | 1.804 | 0.004 |
| 8 | August | 1.83 | 1.804 | 0.026 |
| 9 | September | 1.7 | 1.806 | 0.106 |
| 10 | October | 1.65 | 1.796 | 0.146 |
| 11 | November | 1.7 | 1.781 | 0.081 |
| 12 | December | 1.75 | 1.773 | 0.023 |
| Total | 0.8632 | |||
| MAD | 0.0719 |
Excel worksheet:
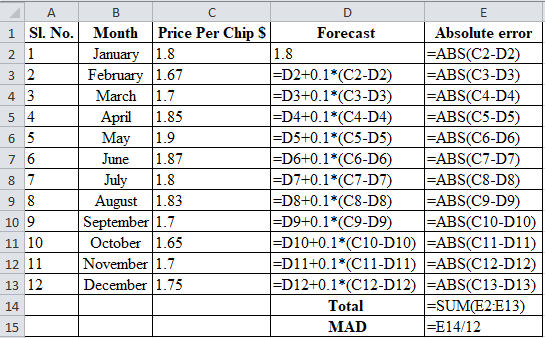
Calculation of absolute error for January:
Absolute Error of January is the modulus of the difference between 1.8 and 1.8, which corresponds to 0. Therefore Absolute Error for January is 0
Calculation of the forecast & absolute error for February:
To calculate forecast for February, substitute the value of forecast of January, smoothing constant and difference of actual and forecasted demand in the above formula. The result of forecast for February is 1.8
Absolute Error of February is the modulus of the difference between 1.67 and 1.8, which corresponds to 0.130 Therefore Absolute Error for February, is 0.130
Forecast and Absolute error for February is 1.8 & 0.130
Calculation of the forecast & absolute error for March:
To calculate forecast for March, substitute the value of forecast of February, smoothing constant and difference of actual and forecasted demand in the above formula. The result of forecast for March is 1.787
Absolute Error of March is the modulus of the difference between 1.7 and 1.787, which corresponds to 0.087 Therefore Absolute Error for March, is 0.087
Forecast and Absolute error for March is 1.787 & 0.087
Calculation of the forecast & absolute error for April:
To calculate forecast for April, substitute the value of forecast of March, smoothing constant and difference of actual and forecasted demand in the above formula. The result of forecast for April is 1.778.
Absolute Error of April is the modulus of the difference between 1.85 and 1.778, which corresponds to 0.072. Therefore Absolute Error for April is 0.087.
Forecast and Absolute error for April is 1.778 & 0.072.
Calculation of the forecast & absolute error for May:
To calculate forecast for May, substitute the value of forecast of April, smoothing constant and difference of actual and forecasted demand in the above formula. The result of forecast for May is 1.785
Absolute Error of May is the modulus of the difference between 1.9 and 1.785, which corresponds to 0.115. Therefore Absolute Error for May is 0.115
Forecast and Absolute error for May is 1.785 & 0.115
Calculation of the forecast & absolute error for June:
To calculate forecast for June, substitute the value of forecast of May, smoothing constant and difference of actual and forecasted demand in the above formula. The result of forecast for June is 1.797.
Absolute Error of June is the modulus of the difference between 1.87 and 1.797, which corresponds to 0.073. Therefore Absolute Error for June is 0.073.
Forecast and Absolute error for June is 1.797 & 0.073.
Calculation of the forecast & absolute error for July:
To calculate forecast for July, substitute the value of forecast of June, smoothing constant and difference of actual and forecasted demand in the above formula. The result of forecast for July is 1.804
Absolute Error of July is the modulus of the difference between 1.8 and 1.804, which corresponds to 0.004. Therefore Absolute Error for July is 0.004
Forecast and Absolute error for July is 1.804 & 0.004
Calculation of the forecast & absolute error for August:
To calculate forecast for August, substitute the value of forecast of July, smoothing constant and difference of actual and forecasted demand in the above formula. The result of forecast for August is 1.804
Absolute Error of August is the modulus of the difference between 1.83 and 1.804, which corresponds to 0.026. Therefore Absolute Error for July is 0.026
Forecast and Absolute error for August is 1.804 & 0.026
Calculation of the forecast & absolute error for September:
To calculate forecast for September, substitute the value of forecast of August, smoothing constant and difference of actual and forecasted demand in the above formula. The result of forecast for September is 1.806
Absolute Error of September is the modulus of the difference between 1.7 and 1.806, which corresponds to 0.106 Therefore Absolute Error for September, is 0.106
Forecast and Absolute error for September is 1.806 & 0.106
Calculation of the forecast & absolute error for October:
To calculate forecast for October, substitute the value of forecast of September, smoothing constant and difference of actual and forecasted demand in the above formula. The result of forecast for October is 1.796
Absolute Error of October is the modulus of the difference between 1.65 and 1.796, which corresponds to 0.146 Therefore Absolute Error for October, is 0.146
Forecast and Absolute error for October is 1.796 & 0.146
Calculation of the forecast & absolute error for November:
To calculate forecast for November, substitute the value of forecast of October, smoothing constant and difference of actual and forecasted demand in the above formula. The result of forecast for November is 1.781.
Absolute Error of November is the modulus of the difference between 1.7 and 1.781, which corresponds to 0.081 Therefore Absolute Error for November, is 0.081.
Forecast and Absolute error for November is 1.781 & 0.081.
Calculation of the forecast & absolute error for December:
To calculate forecast for December, substitute the value of forecast of November, smoothing constant and difference of actual and forecasted demand in the above formula. The result of forecast for December is 1.773.
Absolute Error of December is the modulus of the difference between 1.75 and 1.773, which corresponds to 0.023. Therefore Absolute Error for December is 0.023.
Forecast and Absolute error for December is 1.773 & 0.023.
Calculation of MAD:
Upon substitution of summation value of absolute error for 12 years i.e. 0.8623 is divided by number of years i.e. 12 yields MAD of 0.0719
Mean Absolute Deviation using exponential smoothing with smoothing constant α = 0.1 is 0.0719
Calculation of MAD using exponential smoothing with smoothing constant α = 0.3
| Sl. No. | Month | Price Per Chip $ | Forecast | Absolute error |
| 1 | January | 1.8 | 1.8 | 0 |
| 2 | February | 1.67 | 1.800 | 0.130 |
| 3 | March | 1.7 | 1.761 | 0.061 |
| 4 | April | 1.85 | 1.743 | 0.107 |
| 5 | May | 1.9 | 1.775 | 0.125 |
| 6 | June | 1.87 | 1.812 | 0.058 |
| 7 | July | 1.8 | 1.830 | 0.030 |
| 8 | August | 1.83 | 1.821 | 0.009 |
| 9 | September | 1.7 | 1.824 | 0.124 |
| 10 | October | 1.65 | 1.786 | 0.136 |
| 11 | November | 1.7 | 1.746 | 0.046 |
| 12 | December | 1.75 | 1.732 | 0.018 |
| Total | 0.844 | |||
| MAD | 0.070 |
Excel worksheet:
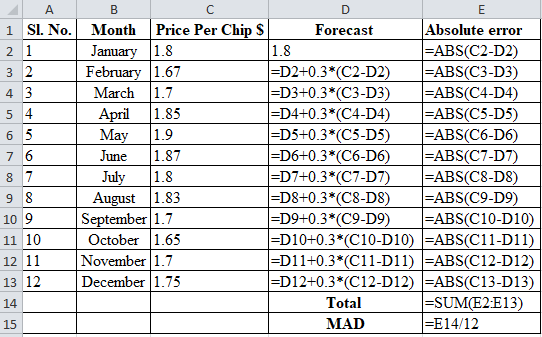
Calculation of the absolute error for January:
Absolute Error of January is the modulus of the difference between 1.8 and 1.8, which corresponds to 0. Therefore Absolute Error for January is 0
Calculation of the forecast & absolute error for February:
To calculate forecast for February, substitute the value of forecast of January, smoothing constant and difference of actual and forecasted demand in the above formula. The result of forecast for February is 1.8.
Absolute Error of February is the modulus of the difference between 1.67 and 1.8, which corresponds to 0.130 Therefore Absolute Error for February, is 0.130.
Forecast and Absolute error for February is 1.800 & 0.130.
Calculation of the forecast & absolute error for March:
To calculate forecast for March, substitute the value of forecast of February, smoothing constant and difference of actual and forecasted demand in the above formula. The result of forecast for March is 1.761.
Absolute Error of March is the modulus of the difference between 1.7 and 1.761, which corresponds to 0.061 Therefore Absolute Error for March, is 0.061.
Forecast and Absolute error for March is 1.761 & 0.061.
Calculation of the forecast & absolute error for April:
To calculate forecast for April, substitute the value of forecast of March, smoothing constant and difference of actual and forecasted demand in the above formula. The result of forecast for April is 1.743.
Absolute Error of April is the modulus of the difference between 1.85 and 1.743, which corresponds to 0.107. Therefore Absolute Error for April is 0.107.
Forecast and Absolute error for April is 1.743 & 0.107.
Calculation of the forecast & absolute error for May:
To calculate forecast for May, substitute the value of forecast of April, smoothing constant and difference of actual and forecasted demand in the above formula. The result of forecast for May is 1.775.
Absolute Error of May is the modulus of the difference between 1.9 and 1.775, which corresponds to 0.125. Therefore Absolute Error for May is 0.125.
Forecast and Absolute error for May is 1.775 & 0.125.
Calculation of the forecast & absolute error for June:
To calculate forecast for June, substitute the value of forecast of May, smoothing constant and difference of actual and forecasted demand in the above formula. The result of forecast for June is 1.812.
Absolute Error of June is the modulus of the difference between 1.87 and 1.812, which corresponds to 0.058. Therefore Absolute Error for June is 0.058.
Forecast and Absolute error for June is 1.812 & 0.058.
Calculation of the forecast & absolute error for July:
To calculate forecast for July, substitute the value of forecast of June, smoothing constant and difference of actual and forecasted demand in the above formula. The result of forecast for July is 1.830.
Absolute Error of July is the modulus of the difference between 1.8 and 1.830, which corresponds to 0.030. Therefore Absolute Error for July is 0.030.
Forecast and Absolute error for July is 1.830 & 0.030.
Calculation of the forecast & absolute error for August:
To calculate forecast for August, substitute the value of forecast of July, smoothing constant and difference of actual and forecasted demand in the above formula. The result of forecast for August is 1.821.
Absolute Error of August is the modulus of the difference between 1.83 and 1.821, which corresponds to 0.009. Therefore Absolute Error for July is 0.009.
Forecast and Absolute error for August is 1.821 & 0.009.
Calculation of the forecast & absolute error for September:
To calculate forecast for September, substitute the value of forecast of August, smoothing constant and difference of actual and forecasted demand in the above formula. The result of forecast for September is 1.824.
Absolute Error of September is the modulus of the difference between 1.7 and 1.824, which corresponds to 0.124 Therefore Absolute Error for September, is 0.124.
Forecast and Absolute error for September is 1.824 & 0.124.
Calculation of the forecast & absolute error for October:
To calculate forecast for October, substitute the value of forecast of September, smoothing constant and difference of actual and forecasted demand in the above formula. The result of forecast for October is 1.786.
Absolute Error of October is the modulus of the difference between 1.65 and 1.786, which corresponds to 0.146 Therefore Absolute Error for October, is 0.136.
Forecast and Absolute error for October is 1.786 & 0.136.
Calculation of the forecast & absolute error for November:
To calculate forecast for November, substitute the value of forecast of October, smoothing constant and difference of actual and forecasted demand in the above formula. The result of forecast for November is 1.746.
Absolute Error of November is the modulus of the difference between 1.7 and 1.746, which corresponds to 0.046 Therefore Absolute Error for November, is 0.046.
Forecast and Absolute error for November is 1.746 & 0.046.
Calculation of the forecast & absolute error for December:
To calculate forecast for December, substitute the value of forecast of November, smoothing constant and difference of actual and forecasted demand in the above formula. The result of forecast for December is 1.732.
Absolute Error of December is the modulus of the difference between 1.75 and 1.773, which corresponds to 0.018. Therefore Absolute Error for December is 0.018.
Forecast and Absolute error for December is 1.732 & 0.018.
Calculation of the Mean Absolute Deviation:
Upon substitution of summation value of absolute error for 12 years i.e. 0.844 is divided by number of years i.e. 12 yields MAD of 0.070.
Mean Absolute Deviation using exponential smoothing with smoothing constant α = 0.3 is 0.070
Calculation of MAD using exponential smoothing with smoothing constant α = 0.5
| Sl. No. | Month | Price Per Chip $ | Forecast | Absolute error |
| 1 | January | 1.8 | 1.8 | 0 |
| 2 | February | 1.67 | 1.800 | 0.130 |
| 3 | March | 1.7 | 1.735 | 0.035 |
| 4 | April | 1.85 | 1.718 | 0.133 |
| 5 | May | 1.9 | 1.784 | 0.116 |
| 6 | June | 1.87 | 1.842 | 0.028 |
| 7 | July | 1.8 | 1.856 | 0.056 |
| 8 | August | 1.83 | 1.828 | 0.002 |
| 9 | September | 1.7 | 1.829 | 0.129 |
| 10 | October | 1.65 | 1.764 | 0.114 |
| 11 | November | 1.7 | 1.707 | 0.007 |
| 12 | December | 1.75 | 1.704 | 0.046 |
| Total | 0.797 | |||
| MAD | 0.066 |
Excel worksheet:
Calculation of the absolute error for January:
Absolute Error of January is the modulus of the difference between 1.8 and 1.8, which corresponds to 0. Therefore Absolute Error for January is 0
Absolute Error for January is 0
Calculation of the forecast & absolute error for February:
To calculate forecast for February, substitute the value of forecast of January, smoothing constant and difference of actual and forecasted demand in the above formula. The result of forecast for February is 1.8
Absolute Error of February is the modulus of the difference between 1.67 and 1.8, which corresponds to 0.130 Therefore Absolute Error for February, is 0.130
Forecast and Absolute error for February is 1.8 & 0.130
Calculation of the forecast & absolute error for March:
To calculate forecast for March, substitute the value of forecast of February, smoothing constant and difference of actual and forecasted demand in the above formula. The result of forecast for March is 1.735
Absolute Error of March is the modulus of the difference between 1.7 and 1.735, which corresponds to 0.035 Therefore Absolute Error for March, is 0.035
Forecast and Absolute error for March is 1.735 & 0.035
Calculation of the forecast & absolute error for April:
To calculate forecast for April, substitute the value of forecast of March, smoothing constant and difference of actual and forecasted demand in the above formula. The result of forecast for April is 1.718
Absolute Error of April is the modulus of the difference between 1.85 and 1.718, which corresponds to 0.133. Therefore Absolute Error for April is 0.133
Forecast and Absolute error for April is 1.718 & 0.133
Calculation of the forecast & absolute error for May:
To calculate forecast for May, substitute the value of forecast of April, smoothing constant and difference of actual and forecasted demand in the above formula. The result of forecast for May is 1.784
Absolute Error of May is the modulus of the difference between 1.9 and 1.784, which corresponds to 0.116. Therefore Absolute Error for May is 0.116
Forecast and Absolute error for May is 1.784 & 0.116
Calculation of the forecast & absolute error for June:
To calculate forecast for June, substitute the value of forecast of May, smoothing constant and difference of actual and forecasted demand in the above formula. The result of forecast for June is 1.842.
Absolute Error of June is the modulus of the difference between 1.87 and 1.842, which corresponds to 0.028. Therefore Absolute Error for June is 0.028.
Forecast and Absolute error for June is 1.842 & 0.028.
Calculation of the forecast & absolute error for July:
To calculate forecast for July, substitute the value of forecast of June, smoothing constant and difference of actual and forecasted demand in the above formula. The result of forecast for July is 1.856.
Absolute Error of July is the modulus of the difference between 1.8 and 1.856, which corresponds to 0.056. Therefore Absolute Error for July is 0.056.
Forecast and Absolute error for July is 1.856 & 0.056.
Calculation of the forecast & absolute error for August:
To calculate forecast for August, substitute the value of forecast of July, smoothing constant and difference of actual and forecasted demand in the above formula. The result of forecast for August is 1.828.
Absolute Error of August is the modulus of the difference between 1.83 and 1.828, which corresponds to 0.002. Therefore Absolute Error for July is 0.002.
Forecast and Absolute error for August is 1.828 & 0.002.
Calculation of the forecast & absolute error for September:
To calculate forecast for September, substitute the value of forecast of August, smoothing constant and difference of actual and forecasted demand in the above formula. The result of forecast for September is 1.829.
Absolute Error of September is the modulus of the difference between 1.7 and 1.829, which corresponds to 0.129 Therefore Absolute Error for September, is 0.129.
Forecast and Absolute error for September is 1.829 & 0.129.
Calculation of the forecast & absolute error for October:
To calculate forecast for October, substitute the value of forecast of September, smoothing constant and difference of actual and forecasted demand in the above formula. The result of forecast for October is 1.764.
Absolute Error of October is the modulus of the difference between 1.65 and 1.764, which corresponds to 0.114 Therefore Absolute Error for October, is 0.114.
Forecast and Absolute error for October is 1.764 & 0.114.
Calculation of the forecast & absolute error for November:
To calculate forecast for November, substitute the value of forecast of October, smoothing constant and difference of actual and forecasted demand in the above formula. The result of forecast for November is 1.707.
Absolute Error of November is the modulus of the difference between 1.7 and 1.707, which corresponds to 0.007 Therefore Absolute Error for November, is 0.007.
Forecast and Absolute error for November is 1.707 & 0.007.
Calculation of the forecast & absolute error for December:
To calculate forecast for December, substitute the value of forecast of November, smoothing constant and difference of actual and forecasted demand in the above formula. The result of forecast for December is 1.704.
Absolute Error of December is the modulus of the difference between 1.75 and 1.704, which corresponds to 0.046. Therefore Absolute Error for December is 0.046.
Forecast and Absolute error for December is 1.704 & 0.046.
Calculation of the Mean Absolute Deviation:
Upon substitution of summation value of absolute error for 11 years i.e. 0.797 is divided by number of years i.e. 12 yields MAD of 0.066.
Mean Absolute Deviation using exponential smoothing with smoothing constant α = 0.1 is 0.066
Hence, the Mean Absolute Deviation using exponential smoothing using α = 0.1 is 0.071, (refer equation 3) α = 0.3 is 0.070 (refer equation 4) and α = 0.5 is 0.066 (refer equation 5). MAD using α = 0.5 is the best method since the MAD is minimum.
Want to see more full solutions like this?
Chapter 4 Solutions
EBK PRINCIPLES OF OPERATIONS MANAGEMENT


- Do you feel there is anything positive about rework?arrow_forwardDo you think technology can achieve faster setup times? How would it be implemented in the hospital workforce?arrow_forwardIn your experience or opinion, do you think process changes like organizing workspaces make a bigger difference, or is investing in technology usually the better solution for faster setups?arrow_forward
- Have you seen rework done in your business, and what was done to prevent that from occurring again?arrow_forwardResearch a company different than case studies examined and search the internet and find an example of a business that had to rework a process. How was the organization affected to rework a process in order to restore a good flow unit? Did rework hurt a process or improve the organization's operational efficiency? • Note: Include a reference with supportive citations in the discussion reply in your post.arrow_forwardSetup time is very important in affecting a process and the capacity of a process. How do you reduce setup time? Give examples of reducing setup time. Please Provide a referenecearrow_forward
- Do you think TPS was successful? If so, how? Are there other companies that have used TPS? If so, give examples. Please provide a referencearrow_forwardGiven the significant impact on finances, production timelines, and even equipment functionality, as you pointed out, what do you believe is the most effective single strategy a company can implement to significantly reduce the occurrence of rework within their operations?arrow_forwardDurban woman, Nombulelo Mkumla, took to social media last week to share how she discovered the rodent.In a lengthy Facebook post, she said she purchased the loaf of bread from a local shop after work on August 27.For the next days, Mkumla proceeded to use slices of bread from the load to make toast."Then, on the morning of August 31, I took the bread out of the fridge to make toast and noticed something disgusting andscary. I took a picture and sent it to my friends, and one of them said, 'Yi mpuku leyo tshomi' [That's a rat friend]“."I was in denial and suggested it might be something else, but the rat scenario made sense - it's possible the rat got into thebread at the factory, and no one noticed," Mkumla said.She went back to the shop she'd bought the bread from and was told to lay a complaint directly with the supplier.She sent an email with a video and photographs of the bread.Mkumla said she was later contacted by a man from Sasko who apologised for the incident.According to…arrow_forward
- PepsiCo South Africa says the incident where a woman discovered part of a rodent in her loaf of bread, is anisolated occurrence.Durban woman, Nombulelo Mkumla, took to social media last week to share how she discovered the rodent.In a lengthy Facebook post, she said she purchased the loaf of bread from a local shop after work on August 27.For the next days, Mkumla proceeded to use slices of bread from the load to make toast."Then, on the morning of August 31, I took the bread out of the fridge to make toast and noticed something disgusting andscary. I took a picture and sent it to my friends, and one of them said, 'Yi mpuku leyo tshomi' [That's a rat friend]“."I was in denial and suggested it might be something else, but the rat scenario made sense - it's possible the rat got into thebread at the factory, and no one noticed," Mkumla said.She went back to the shop she'd bought the bread from and was told to lay a complaint directly with the supplier.She sent an email with a video and…arrow_forwardDurban woman, Nombulelo Mkumla, took to social media last week to share how she discovered the rodent.In a lengthy Facebook post, she said she purchased the loaf of bread from a local shop after work on August 27.For the next days, Mkumla proceeded to use slices of bread from the load to make toast."Then, on the morning of August 31, I took the bread out of the fridge to make toast and noticed something disgusting andscary. I took a picture and sent it to my friends, and one of them said, 'Yi mpuku leyo tshomi' [That's a rat friend]“."I was in denial and suggested it might be something else, but the rat scenario made sense - it's possible the rat got into thebread at the factory, and no one noticed," Mkumla said.She went back to the shop she'd bought the bread from and was told to lay a complaint directly with the supplier.She sent an email with a video and photographs of the bread.Mkumla said she was later contacted by a man from Sasko who apologised for the incident.According to…arrow_forwardRead the project statement and answer ALL of the questions that follow PROJECT STATEMENT The African Integrated High-Speed Railway Network (AIHSRN). African nations are preparing to invest billions in a significant overhaul of their rail infrastructure as part of an ambitious plan for the continent. One of the key projects underway is the African Integrated High-Speed Railway Network (AIHSRN), which aims to connect Africa's capital cities and major commercial centres with a high-speed railway network to enhance continental trade and competition. This network will span 2,000 km (1,243 miles) and connect 60 cities, including Nairobi, Lagos, Cairo, and Dakar. It will improve access to essential markets, enhance economic cooperation, and encourage regional collaboration. The plan is poised to revolutionise intra-African trade by reducing travel times and lowering transportation costs, making trade between African nations more competitive. The trains will be capable of reaching speeds of up…arrow_forward
 MarketingMarketingISBN:9780357033791Author:Pride, William MPublisher:South Western Educational Publishing
 Contemporary MarketingMarketingISBN:9780357033777Author:Louis E. Boone, David L. KurtzPublisher:Cengage Learning
 Practical Management ScienceOperations ManagementISBN:9781337406659Author:WINSTON, Wayne L.Publisher:Cengage,
 Purchasing and Supply Chain ManagementOperations ManagementISBN:9781285869681Author:Robert M. Monczka, Robert B. Handfield, Larry C. Giunipero, James L. PattersonPublisher:Cengage Learning