Concept explainers
Videos
29. Advertising A small manufacturing firm collected the following data on advertising expenditures A (in thousands of dollars) and total revenue R (in thousands of dollars).
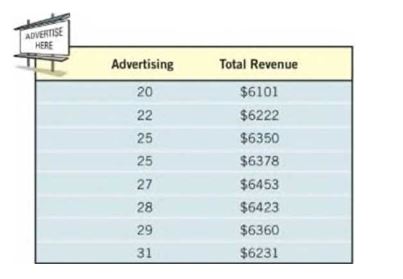
(a) Draw a
(b) The quadratic function of best fit to these data is
Use this function to determine the optimal level of advertising.
(c) Use the function to predict the total revenue when the optimal level of advertising is spent.
(d) Use a graphing utility to verify that the function given in part (b) is the quadratic function of best fit.
(e) Use a graphing utility to draw a scatter diagram of the data and then graph the quadratic function of best fit on the scatter diagram.
Want to see the full answer?
Check out a sample textbook solution
Chapter 3 Solutions
Precalculus Enhanced with Graphing Utilities, Books a la Carte Edition Plus NEW MyLab Math -- Access Card Package (7th Edition)
Additional Math Textbook Solutions
Basic Business Statistics, Student Value Edition
A First Course in Probability (10th Edition)
Algebra and Trigonometry (6th Edition)
Elementary Statistics (13th Edition)
Elementary Statistics
Elementary Statistics: Picturing the World (7th Edition)


- (1) (16 points) Let f(x, y) = 2x + 3y + In(xy) (a) (6 points) Calculate the gradient field Vf(x, y) and determine all points (x, y) where ▼f(x, y) = (0, 0). (b) (4 points) Calculate the second derivative matrix D²f(x,y).arrow_forwardLet f(x, y) = 2x + 3y+ In(xy)arrow_forward(3) (16 points) Let D = [0, π/2] × [0, 7/6]. Define T: DCR2 R3 by → T(0, 4) = (2 sin cos 0, 2 sin sin 0, 2 cos x). Let S be the surface parametrized by T. (a) (8 points) Determine the normal, call it n(p), for the tangent plane TS at an arbitrary point p = T(0, 4). (b) (4 points) Show that n(p) parallel to the position vector T(0, 4) determined by p? Do the two vectors have the same direction or opposite direction? Explain. (c) (4 points) At which points p, if any, is TS parallel to the xy-plane?arrow_forward
- 5:19 0 TEMU TEMU >>> 49 95% University at Albany - Single Sig... L Lumen OHM D2L HW4- AMAT100-Precal HW4 Score: 12.99/21 Answered: 18/21 × Question 16 Score on last try: 0 of 1 pts. See Details for more. > Next question Get a similar question You can retry this question below Find the inverse for the function k(x) = √√7x+12 k-¹(x) = Question Help: Video Message instructor Submit Question esc ||| F1 80 ୮ (x) = tarrow_forwarduse components when solvingarrow_forwardmin(sin x, cos x) 2πT 0 max (esin x, ecos x dxarrow_forward
 Algebra & Trigonometry with Analytic GeometryAlgebraISBN:9781133382119Author:SwokowskiPublisher:Cengage
 Glencoe Algebra 1, Student Edition, 9780079039897...AlgebraISBN:9780079039897Author:CarterPublisher:McGraw Hill
 Holt Mcdougal Larson Pre-algebra: Student Edition...AlgebraISBN:9780547587776Author:HOLT MCDOUGALPublisher:HOLT MCDOUGAL
 Algebra for College StudentsAlgebraISBN:9781285195780Author:Jerome E. Kaufmann, Karen L. SchwittersPublisher:Cengage Learning