Videos
Which Model? A cricket makes a chirping noise by sliding its wings together rapidly. Perhaps you have noticed that the rapidity of chirps seems to increase with the temperature. The following data list the temperature (in degrees Fahrenheit) and the number of chirps per second for the striped ground cricket.
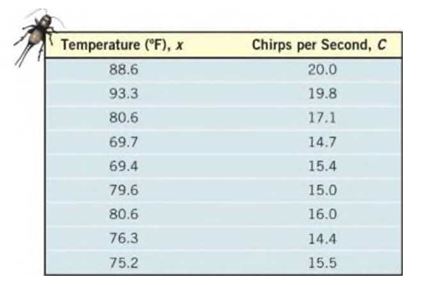
(a) Using a graphing utility, draw a
(b) Based on your response to part (a), find either a linear or a quadratic model that best describes the relation between temperature and chirps per second.
Use your model to predict the chirps per second if the temperature is .
Want to see the full answer?
Check out a sample textbook solution
Chapter 3 Solutions
Precalculus Enhanced with Graphing Utilities, Books a la Carte Edition Plus NEW MyLab Math -- Access Card Package (7th Edition)
Additional Math Textbook Solutions
University Calculus: Early Transcendentals (4th Edition)
College Algebra (7th Edition)
Calculus: Early Transcendentals (2nd Edition)
Elementary Statistics
Introductory Statistics
Elementary Statistics (13th Edition)


- Complete the square and find the indefinite integral. (Remember to use absolute values where appropriate. Use C for the constant of integration.) dx x²-12x+27arrow_forwardComplete the table. Enter DNE if a quantity doesn't exist or NEI if not enough information is given. f(c) limx-->c- f(x) limx-->c+ f(x) limx -->c f(x) continuity at x=c 2 4arrow_forwardFind the indefinite integral. (Use C for the constant of integration.) 9x arcsin(x) dxarrow_forward
- Find the indefinite integral using the substitution x = 5 sin(e). (Use C for the constant of integration.) 1 dx (25-x²)3/2arrow_forwardFind the indefinite integral using the substitution x = 7 sec(0). (Use C for the constant of integration.) √ ׳ √x² - 49 dxarrow_forward2 Graph of h 6. The graph of the function h is given in the xy-plane. Which of the following statements is correct? , the graph of h is increasing at an increasing rate. (A) For (B) For (C) For 苏|4 K|4 π π , the graph of h is increasing at a decreasing rate. 2 0 and b>1 (B) a>0 and 01 (D) a<0 and 0arrow_forward3. Consider the sequences of functions fn: [-T, π] → R, sin(n²x) n(2) n (i) Find a function f : [-T, π] R such that fnf pointwise as n∞. Further, show that f uniformly on [-T,π] as n→ ∞. [20 Marks] (ii) Does the sequence of derivatives f(x) has a pointwise limit on [-7,π]? Justify your answer. [10 Marks]arrow_forwardGood Day, Please assist with the following. Regards,arrow_forwardFor each given function f(x) find f'(x) using the rules learned in section 9.5. 1. f(x)=x32 32x 2. f(x)=7x+13 3. f(x) = x4 4. f(x) = √√x³ 5. f(x) = 3x²+ 3 x2arrow_forwardarrow_back_iosSEE MORE QUESTIONSarrow_forward_ios
 Glencoe Algebra 1, Student Edition, 9780079039897...AlgebraISBN:9780079039897Author:CarterPublisher:McGraw Hill
 Algebra & Trigonometry with Analytic GeometryAlgebraISBN:9781133382119Author:SwokowskiPublisher:Cengage
 Big Ideas Math A Bridge To Success Algebra 1: Stu...AlgebraISBN:9781680331141Author:HOUGHTON MIFFLIN HARCOURTPublisher:Houghton Mifflin Harcourt
 College Algebra (MindTap Course List)AlgebraISBN:9781305652231Author:R. David Gustafson, Jeff HughesPublisher:Cengage Learning
 Algebra: Structure And Method, Book 1AlgebraISBN:9780395977224Author:Richard G. Brown, Mary P. Dolciani, Robert H. Sorgenfrey, William L. ColePublisher:McDougal Littell