Concept explainers
Videos
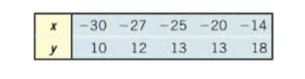
In Problems 11-16,
(a) Draw a
(b) Select two points from the scatter diagram and find the equation of the line containing the points selected.
(c) Graph the line found in part (b) on the scatter diagram.
(d) Use a graphing utility to find the line of best fit.
(e) Use a graphing utility to draw the scatter diagram and graph the line of best fit on it.
Want to see the full answer?
Check out a sample textbook solution
Chapter 3 Solutions
Precalculus Enhanced with Graphing Utilities, Books a la Carte Edition Plus NEW MyLab Math -- Access Card Package (7th Edition)
Additional Math Textbook Solutions
Elementary Statistics: Picturing the World (7th Edition)
Intro Stats, Books a la Carte Edition (5th Edition)
College Algebra (7th Edition)
Algebra and Trigonometry (6th Edition)
Introductory Statistics
Calculus for Business, Economics, Life Sciences, and Social Sciences (14th Edition)


- Pls help me with accurate answer asap plsarrow_forwardPls help me asap pls plsarrow_forwardExercise 1 Given are the following planes: plane 1: 3x4y+z = 1 0 plane 2: (s, t) = ( 2 ) + ( -2 5 s+ 0 ( 3 t 2 -2 a) Find for both planes the Hessian normal form and for plane 1 in addition the parameter form. b) Use the cross product of the two normal vectors to show that the planes intersect in a line. c) Calculate the intersection line. d) Calculate the intersection angle of the planes. Make a sketch to indicate which angle you are calculating.arrow_forward
- Only 100% sure experts solve it correct complete solutions okarrow_forwardrmine the immediate settlement for points A and B shown in figure below knowing that Aq,-200kN/m², E-20000kN/m², u=0.5, Depth of foundation (DF-0), thickness of layer below footing (H)=20m. 4m B 2m 2m A 2m + 2m 4marrow_forwardsy = f(x) + + + + + + + + + X 3 4 5 7 8 9 The function of shown in the figure is continuous on the closed interval [0, 9] and differentiable on the open interval (0, 9). Which of the following points satisfies conclusions of both the Intermediate Value Theorem and the Mean Value Theorem for f on the closed interval [0, 9] ? (A A B B C Darrow_forward
- = Q6 What will be the allowable bearing capacity of sand having p = 37° and ydry 19 kN/m³ for (i) 1.5 m strip foundation (ii) 1.5 m x 1.5 m square footing and (iii)1.5m x 2m rectangular footing. The footings are placed at a depth of 1.5 m below ground level. Assume F, = 2.5. Use Terzaghi's equations. 0 Ne Na Ny 35 57.8 41.4 42.4 40 95.7 81.3 100.4arrow_forwardQ1 The SPT records versus depth are given in table below. Find qan for the raft 12% foundation with BxB-10x10m and depth of raft D-2m, the allowable settlement is 50mm. Elevation, m 0.5 2 2 6.5 9.5 13 18 25 No.of blows, N 11 15 29 32 30 44 0 estigate shear 12%arrow_forwardQ2 A/ State the main field tests which may be carried out to investigate shear strength of a soil layer? B/ What are the main factors that affecting the spacing and number of boreholes for a given project? C/ Illustrate the causes of disturbance of Shelby tubes samples.arrow_forward
 Holt Mcdougal Larson Pre-algebra: Student Edition...AlgebraISBN:9780547587776Author:HOLT MCDOUGALPublisher:HOLT MCDOUGAL
 Elementary AlgebraAlgebraISBN:9780998625713Author:Lynn Marecek, MaryAnne Anthony-SmithPublisher:OpenStax - Rice University
 Intermediate AlgebraAlgebraISBN:9781285195728Author:Jerome E. Kaufmann, Karen L. SchwittersPublisher:Cengage Learning
 Algebra and Trigonometry (MindTap Course List)AlgebraISBN:9781305071742Author:James Stewart, Lothar Redlin, Saleem WatsonPublisher:Cengage Learning