Precalculus Enhanced with Graphing Utilities, Books a la Carte Edition Plus NEW MyLab Math -- Access Card Package (7th Edition)
7th Edition
ISBN: 9780134268231
Author: Michael Sullivan, Michael Sullivan III
Publisher: PEARSON
expand_more
expand_more
format_list_bulleted
Concept explainers
Videos
Textbook Question
Chapter 3.2, Problem 15SB
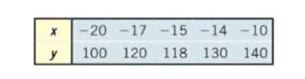
In Problems 11-16,
(a) Draw a
(b) Select two points from the scatter diagram and find the equation of the line containing the points selected.
(c) Graph the line found in part (b) on the scatter diagram.
(d) Use a graphing utility to find the line of best fit.
(e) Use a graphing utility to draw the scatter diagram and graph the line of best fit on it.
Expert Solution & Answer
Want to see the full answer?
Check out a sample textbook solution
Students have asked these similar questions
Evaluate the integral.
Scos
3
cos x sin xdx
Evaluate the integral using integration by parts.
150 sec 20
Evaluate the integral using integration by parts.
Stan (13y)dy
Chapter 3 Solutions
Precalculus Enhanced with Graphing Utilities, Books a la Carte Edition Plus NEW MyLab Math -- Access Card Package (7th Edition)
Ch. 3.1 - Graph y=2x3 . (pp. 32-35)Ch. 3.1 - Find the slope of the line joining the points (...Ch. 3.1 - Find the average rate of change of f(x)=3 x 2 2 ,...Ch. 3.1 - Solve: 6x900=15x+2850 . (pp. A44-A46)Ch. 3.1 - If f( x )= x 2 4 , find f( 2 ) . (pp. 60-62)Ch. 3.1 - True or False The graph of the function f( x )= x...Ch. 3.1 - For the graph of the linear function f( x )=mx+b ,...Ch. 3.1 - If the slope m of the graph of a linear function...Ch. 3.1 - True or False The slope of a nonvertical line is...Ch. 3.1 - True or False The average rate of change of f( x...
Ch. 3.1 - What is the only type of function that has a...Ch. 3.1 - A car has 12,500 miles on its odometer. Say the...Ch. 3.1 - In Problems 13-20, a linear function is given. a....Ch. 3.1 - In Problems 13-20, a linear function is given. a....Ch. 3.1 - In Problems 13-20, a linear function is given. a....Ch. 3.1 - In Problems 13-20, a linear function is given. a....Ch. 3.1 - In Problems 13-20, a linear function is given. a....Ch. 3.1 - In Problems 13-20, a linear function is given. a....Ch. 3.1 - In Problems 13-20, a linear function is given. a....Ch. 3.1 - In Problems 13-20, a linear function is given. a....Ch. 3.1 - In Problems 21-28, determine whether the given...Ch. 3.1 - In Problems 21-28, determine whether the given...Ch. 3.1 - In Problems 21-28, determine whether the given...Ch. 3.1 - In Problems 21-28, determine whether the given...Ch. 3.1 - In Problems 21-28, determine whether the given...Ch. 3.1 - In Problems 21-28, determine whether the given...Ch. 3.1 - In Problems 21-28, determine whether the given...Ch. 3.1 - In Problems 21-28, determine whether the given...Ch. 3.1 - Suppose that f( x )=4x1 and g(x)=2x+5 . a. Solve...Ch. 3.1 - Suppose that f( x )=3x+5 and g(x)=2x+15 . a. Solve...Ch. 3.1 - In parts (a) - (f), use the following figure. a....Ch. 3.1 - In parts (a) - (f), use the following figure. a....Ch. 3.1 - In parts (a) and (b), use the following figure. a....Ch. 3.1 - In parts (a) and (b), use the following figure. a....Ch. 3.1 - In parts (a) and (b), use the following figure. a....Ch. 3.1 - In parts (a) and (b), use the following figure. a....Ch. 3.1 - Car Rentals The cost C , in dollars, of a one-day...Ch. 3.1 - Phone Charges The monthly cost C , in dollars, for...Ch. 3.1 - Supply and Demand Suppose that the quantity...Ch. 3.1 - Supply and Demand Suppose that the quantity...Ch. 3.1 - Taxes The function T( x )=0.15(x9225)+922.50...Ch. 3.1 - Competitive Balance Tax In 2011, major league...Ch. 3.1 - The point at which a company’s profits equal...Ch. 3.1 - The point at which a company’s profits equal...Ch. 3.1 - Straight-line Depreciation Suppose that a company...Ch. 3.1 - Straight-line Depreciation Suppose that a company...Ch. 3.1 - Cost Function The simplest cost function is the...Ch. 3.1 - Cost Function Refer to Problem 47. Suppose that...Ch. 3.1 - Truck Rentals A truck rental company rents a truck...Ch. 3.1 - International Calling A cell phone company offers...Ch. 3.1 - Developing a Linear Model from Data How many songs...Ch. 3.1 - Developing a Linear Model from Data The following...Ch. 3.1 - Which of the following functions might have the...Ch. 3.1 - Which of the following functions might have the...Ch. 3.1 - Under what circumstances is a linear function f( x...Ch. 3.1 - Explain how the graph of f( x )=mx+b can be used...Ch. 3.1 - Problems 57-60 are based on material teamed...Ch. 3.1 - Problems 57-60 are based on material teamed...Ch. 3.1 - Problems 57-60 are based on material teamed...Ch. 3.1 - Problems 57-60 are based on material teamed...Ch. 3.2 - Plot the points ( 1,5 ),( 2,6 ),( 3,9 ),( 1,12 )...Ch. 3.2 - Find an equation of the line containing the points...Ch. 3.2 - A _____________ is used to help us to see what...Ch. 3.2 - If the Independent variable in a line of best fit...Ch. 3.2 - In Problems 5-10, examine the scatter diagram and...Ch. 3.2 - In Problems 5-10, examine the scatter diagram and...Ch. 3.2 - In Problems 5-10, examine the scatter diagram and...Ch. 3.2 - In Problems 5-10, examine the scatter diagram and...Ch. 3.2 - In Problems 5-10, examine the scatter diagram and...Ch. 3.2 - In Problems 5-10, examine the scatter diagram and...Ch. 3.2 - In Problems 11-16, (a) Draw a scatter diagram. (b)...Ch. 3.2 - In Problems 11-16, (a) Draw a scatter diagram. (b)...Ch. 3.2 - In Problems 11-16, (a) Draw a scatter diagram. (b)...Ch. 3.2 - In Problems 11-16, (a) Draw a scatter diagram. (b)...Ch. 3.2 - In Problems 11-16, (a) Draw a scatter diagram. (b)...Ch. 3.2 - In Problems 11-16, (a) Draw a scatter diagram. (b)...Ch. 3.2 - Candy The following data represent the weight (in...Ch. 3.2 - Tornadoes The following data represent the width...Ch. 3.2 - Video Games and Grade-Point Average Professor...Ch. 3.2 - Hurricanes The following data represent the...Ch. 3.2 - Homeruns A baseball analyst wishes to find a...Ch. 3.2 - Demand for Jeans The marketing manager at...Ch. 3.2 - Maternal Age versus Down Syndrome A biologist...Ch. 3.2 - Find the line of best fit for the ordered pairs (...Ch. 3.2 - What does a correlation coefficient of 0 imply?Ch. 3.2 - Explain why it does not make sense to interpret...Ch. 3.2 - Refer to Problem 19. Solve G( h )=0 . Provide an...Ch. 3.2 - Find an equation for the line containing the...Ch. 3.2 - Find the domain of f( x )= x1 x 2 25 .Ch. 3.2 - For f(x)=5x8 and g(x)= x 2 3x+4 , find (gf)(x) .Ch. 3.2 - Write the function whose graph is the graph of y=...Ch. 3.3 - List the intercepts of the equation y= x 2 9 ....Ch. 3.3 - Prob. 2AYPCh. 3.3 - To complete the square of x 2 5x , you add the...Ch. 3.3 - To graph y= (x4) 2 you shift the graph of y= x 2...Ch. 3.3 - The graph of a quadratic function is called a(n)...Ch. 3.3 - The vertical line passing through the vertex of a...Ch. 3.3 - The x-coordinate of the vertex of f( x )=a x 2...Ch. 3.3 - True or False The graph of f( x )=2 x 2 +3x4 opens...Ch. 3.3 - True or False The y-coordinate of the vertex of f(...Ch. 3.3 - True or False If the discriminant b 2 4ac=0 , the...Ch. 3.3 - If b 2 4ac0 , which of the following conclusions...Ch. 3.3 - If the graph of f( x )=a x 2 +bx+c,a0 , has a...Ch. 3.3 - In Problems 13-20, match each graph to one the...Ch. 3.3 - In Problems 13-20, match each graph to one the...Ch. 3.3 - In Problems 13-20, match each graph to one the...Ch. 3.3 - In Problems 13-20, match each graph to one the...Ch. 3.3 - In Problems 13-20, match each graph to one the...Ch. 3.3 - In Problems 13-20, match each graph to one the...Ch. 3.3 - In Problems 13-20, match each graph to one the...Ch. 3.3 - In Problems 13-20, match each graph to one the...Ch. 3.3 - In Problems 21-32, graph the function f by...Ch. 3.3 - In Problems 21-32, graph the function f by...Ch. 3.3 - In Problems 21-32, graph the function f by...Ch. 3.3 - In Problems 21-32, graph the function f by...Ch. 3.3 - In Problems 21-32, graph the function f by...Ch. 3.3 - In Problems 21-32, graph the function f by...Ch. 3.3 - In Problems 21-32, graph the function f by...Ch. 3.3 - In Problems 21-32, graph the function f by...Ch. 3.3 - In Problems 21-32, graph the function f by...Ch. 3.3 - In Problems 21-32, graph the function f by...Ch. 3.3 - In Problems 21-32, graph the function f by...Ch. 3.3 - In Problems 21-32, graph the function f by...Ch. 3.3 - In Problems 33-48, (a) graph each quadratic...Ch. 3.3 - In Problems 33-48, (a) graph each quadratic...Ch. 3.3 - In Problems 33-48, (a) graph each quadratic...Ch. 3.3 - In Problems 33-48, (a) graph each quadratic...Ch. 3.3 - In Problems 33-48, (a) graph each quadratic...Ch. 3.3 - In Problems 33-48, (a) graph each quadratic...Ch. 3.3 - In Problems 33-48, (a) graph each quadratic...Ch. 3.3 - In Problems 33-48, (a) graph each quadratic...Ch. 3.3 - In Problems 33-48, (a) graph each quadratic...Ch. 3.3 - In Problems 33-48, (a) graph each quadratic...Ch. 3.3 - In Problems 33-48, (a) graph each quadratic...Ch. 3.3 - In Problems 33-48, (a) graph each quadratic...Ch. 3.3 - In Problems 33-48, (a) graph each quadratic...Ch. 3.3 - In Problems 33-48, (a) graph each quadratic...Ch. 3.3 - In Problems 33-48, (a) graph each quadratic...Ch. 3.3 - In Problems 33-48, (a) graph each quadratic...Ch. 3.3 - In Problems 49-54, determine the quadratic...Ch. 3.3 - In Problems 49-54, determine the quadratic...Ch. 3.3 - In Problems 49-54, determine the quadratic...Ch. 3.3 - In Problems 49-54, determine the quadratic...Ch. 3.3 - In Problems 49-54, determine the quadratic...Ch. 3.3 - In Problems 49-54, determine the quadratic...Ch. 3.3 - In Problems 55-62, determine, without graphing,...Ch. 3.3 - In Problems 55-62, determine, without graphing,...Ch. 3.3 - In Problems 55-62, determine, without graphing,...Ch. 3.3 - In Problems 55-62, determine, without graphing,...Ch. 3.3 - In Problems 55-62, determine, without graphing,...Ch. 3.3 - In Problems 55-62, determine, without graphing,...Ch. 3.3 - In Problems 55-62, determine, without graphing,...Ch. 3.3 - In Problems 55-62, determine, without graphing,...Ch. 3.3 - In Problems 63-74, (a) graph each function, (b)...Ch. 3.3 - In Problems 63-74, (a) graph each function, (b)...Ch. 3.3 - In Problems 63-74, (a) graph each function, (b)...Ch. 3.3 - In Problems 63-74, (a) graph each function, (b)...Ch. 3.3 - In Problems 63-74, (a) graph each function, (b)...Ch. 3.3 - In Problems 63-74, (a) graph each function, (b)...Ch. 3.3 - In Problems 63-74, (a) graph each function, (b)...Ch. 3.3 - In Problems 63-74, (a) graph each function, (b)...Ch. 3.3 - In Problems 63-74, (a) graph each function, (b)...Ch. 3.3 - In Problems 63-74, (a) graph each function, (b)...Ch. 3.3 - In Problems 63-74, (a) graph each function, (b)...Ch. 3.3 - In Problems 63-74, (a) graph each function, (b)...Ch. 3.3 - The graph of the function f( x )=a x 2 +bx+c has...Ch. 3.3 - The graph of the function f(x)=a x 2 +bx+c has...Ch. 3.3 - In Problems 77-82, for the given functions fandg ,...Ch. 3.3 - In Problems 77-82, for the given functions fandg ,...Ch. 3.3 - In Problems 77-82, for the given functions fandg ,...Ch. 3.3 - In Problems 77-82, for the given functions fandg ,...Ch. 3.3 - In Problems 77-82, for the given functions fandg ,...Ch. 3.3 - In Problems 77-82, for the given functions fandg ,...Ch. 3.3 - Answer Problems 83 and 84 using the following: A...Ch. 3.3 - Answer Problems 83 and 84 using the following: A...Ch. 3.3 - Suppose that f(x)= x 2 +4x21 . (a) What is the...Ch. 3.3 - Suppose that f( x )= x 2 +2x8 . (a) What is the...Ch. 3.3 - Find the point on the line y=x that is closest to...Ch. 3.3 - Find the point on the line y=x+1 that is closest...Ch. 3.3 - Maximizing Revenue Suppose that the manufacturer...Ch. 3.3 - Maximizing Revenue The John Deere company has...Ch. 3.3 - Minimizing Marginal Cost The marginal cost of a...Ch. 3.3 - Minimizing Marginal Cost (See Problem 91.) The...Ch. 3.3 - Business The monthly revenue R achieved by selling...Ch. 3.3 - Business The daily revenue R achieved by selling x...Ch. 3.3 - Stopping Distance An accepted relationship between...Ch. 3.3 - Birthrate for Unmarried Women In the United...Ch. 3.3 - Let f( x )=a x 2 +bx+c , where a,b,andc are odd...Ch. 3.3 - Make up a quadratic function that opens down and...Ch. 3.3 - On one set of coordinate axes, graph the family of...Ch. 3.3 - On one set of coordinate axes, graph the family of...Ch. 3.3 - State the circumstances that cause the graph of a...Ch. 3.3 - Why does the graph of a quadratic function open up...Ch. 3.3 - Can a quadratic function have a range of ( , ) ?...Ch. 3.3 - What are the possibilities for the number of times...Ch. 3.3 - Determine whether x 2 +4 y 2 =16 is symmetric...Ch. 3.3 - Find the domain of f(x)= 82x .Ch. 3.3 - Prob. 107RYKCh. 3.3 - Write the function whose graph is the graph of y=...Ch. 3.4 - Translate the following sentence into a...Ch. 3.4 - Use a graphing utility to find the line of best...Ch. 3.4 - Maximizing Revenue The price p (in dollars) and...Ch. 3.4 - Maximizing Revenue The price p (in dollars) and...Ch. 3.4 - Maximizing Revenue The price p (in dollars) and...Ch. 3.4 - Maximizing Revenue The price p (in dollars) and...Ch. 3.4 - Enclosing a Rectangular Field David has 400 yards...Ch. 3.4 - Enclosing a Rectangular Field Beth has 3000 feet...Ch. 3.4 - Enclosing a Rectangular Field with a Fence A...Ch. 3.4 - Enclosing a Rectangular Field with a Fence A...Ch. 3.4 - Analyzing the Motion of a Projectile A projectile...Ch. 3.4 - Analyzing the Motion of a Projectile A projectile...Ch. 3.4 - Suspension Bridge A suspension bridge with weight...Ch. 3.4 - Architecture A parabolic arch has a span of 120...Ch. 3.4 - Constructing Rain Gutters A rain gutter is to be...Ch. 3.4 - Norman Windows A Norman window has the shape of a...Ch. 3.4 - Constructing a Stadium A track-and-field playing...Ch. 3.4 - Architecture A special window has the shape of a...Ch. 3.4 - Chemical Reactions A self-catalytic chemical...Ch. 3.4 - Calculus: Simpson's Rule The figure shows the...Ch. 3.4 - Use the result obtained in Problem 20 to find the...Ch. 3.4 - Use the result obtained in Problem 20 to find the...Ch. 3.4 - Use the result obtained in Problem 20 to find the...Ch. 3.4 - Use the result obtained in Problem 20 to find the...Ch. 3.4 - Life Cycle Hypothesis An individuals income varies...Ch. 3.4 - Height of a Rail A shot-putter throws a hall at an...Ch. 3.4 - Which Model? The following data represent the...Ch. 3.4 - Which Model? An engineer collects the following...Ch. 3.4 - Which Model? The following data represent the...Ch. 3.4 - Which Model? A cricket makes a chirping noise by...Ch. 3.4 - Refer to Example 1 in this section. Notice that if...Ch. 3.4 - Find an equation of the line containing the points...Ch. 3.4 - Find the distance between the points P 1 =( 4,7 )...Ch. 3.4 - Prob. 34RYKCh. 3.4 - Find the intercepts of the graph of 3 x 2 4y=48 .Ch. 3.5 - Solve the inequality 3x27 .Ch. 3.5 - Write (2,7] using inequality notation.Ch. 3.5 - (a) f( x )0 (b) f( x )0Ch. 3.5 - (a) g( x )0 (b) g( x )0Ch. 3.5 - (a) g( x )f( x ) (b) f( x )g( x )Ch. 3.5 - (a) f( x )g( x ) (b) f( x )g( x )Ch. 3.5 - x 2 3x100Ch. 3.5 - x 2 +3x100Ch. 3.5 - x 2 4x0Ch. 3.5 - x 2 +8x0Ch. 3.5 - x 2 90Ch. 3.5 - x 2 10Ch. 3.5 - x 2 +x12Ch. 3.5 - x 2 +7x12Ch. 3.5 - 2 x 2 5x+3Ch. 3.5 - 6 x 2 6+5xCh. 3.5 - x 2 x+10Ch. 3.5 - x 2 +2x+40Ch. 3.5 - 4 x 2 +96xCh. 3.5 - 25 x 2 +1640xCh. 3.5 - 6( x 2 1 )5xCh. 3.5 - 2( 2 x 2 3x )9Ch. 3.5 - What is the domain of the function f( x )= x 2 16...Ch. 3.5 - What is the domain of the function f( x )= x3 x 2...Ch. 3.5 - In Problems 25-32, use the given functions f and g...Ch. 3.5 - In Problems 25-32, use the given functions f and g...Ch. 3.5 - In Problems 25-32, use the given functions f and g...Ch. 3.5 - In Problems 25-32, use the given functions f and g...Ch. 3.5 - In Problems 25-32, use the given functions f and g...Ch. 3.5 - In Problems 25-32, use the given functions f and g...Ch. 3.5 - In Problems 25-32, use the given functions f and g...Ch. 3.5 - In Problems 25-32, use the given functions f and g...Ch. 3.5 - Physics A ball is thrown vertically upward with an...Ch. 3.5 - Physics A ball is thrown vertically upward with an...Ch. 3.5 - Revenue Suppose that the manufacturer of a gas...Ch. 3.5 - Revenue The John Deere company has found that the...Ch. 3.5 - Artillery A projectile Fired from the point ( 0,0...Ch. 3.5 - Runaway Car Using Hooke's Law, we can show that...Ch. 3.5 - Show that the inequality ( x4 ) 2 0 has exactly...Ch. 3.5 - Show that the inequality ( x2 ) 2 0 has one real...Ch. 3.5 - Explain why the inequality x 2 +x+10 has all real...Ch. 3.5 - Explain why the inequality x 2 x+10 has the empty...Ch. 3.5 - Explain the circumstances under which the...Ch. 3.5 - Determine the domain of f( x )= 102x .Ch. 3.5 - Consider the linear function f( x )= 2 3 x6 . (a)...Ch. 3.5 - Determine algebraically whether f( x )= x x 2 +9...Ch. 3.5 - Determine whether the graphs of 6x3y=10 and 2x+y=8...Ch. 3.R - In Problems 1-3: (a) Determine the slope and...Ch. 3.R - In Problems 1-3: (a) Determine the slope and...Ch. 3.R - In Problems 1-3: (a) Determine the slope and...Ch. 3.R - In Problems 4 and 5, determine whether the...Ch. 3.R - In Problems 4 and 5, determine whether the...Ch. 3.R - In Problems 6-8, graph each quadratic function...Ch. 3.R - In Problems 6-8, graph each quadratic function...Ch. 3.R - In Problems 6-8, graph each quadratic function...Ch. 3.R - In Problems 9-14, (a) graph each quadratic...Ch. 3.R - In Problems 9-14, (a) graph each quadratic...Ch. 3.R - In Problems 9-14, (a) graph each quadratic...Ch. 3.R - In Problems 9-14, (a) graph each quadratic...Ch. 3.R - In Problems 9-14, (a) graph each quadratic...Ch. 3.R - In Problems 9-14, (a) graph each quadratic...Ch. 3.R - In Problems 15-17, determine whether the given...Ch. 3.R - In Problems 15-17, determine whether the given...Ch. 3.R - In Problems 15-17, determine whether the given...Ch. 3.R - In Problems 18-19, solve each quadratic...Ch. 3.R - In Problems 18-19, solve each quadratic...Ch. 3.R - 20. In Problems 20 and 21, find the quadratic...Ch. 3.R - 21. In Problems 20 and 21, find the quadratic...Ch. 3.R - 22. Sales Commissions Bill has just been offered a...Ch. 3.R - 23. Demand Equation the price p (in dollars) and...Ch. 3.R - 24. Enclosing the Most Area with a Fence A farmer...Ch. 3.R - 25. Minimizing Marginal Cost Callaway Golf Company...Ch. 3.R - 26. Maximizing Area A rectangle has one vertex on...Ch. 3.R - 27. Parabolic Arch Bridge A horizontal bridge is...Ch. 3.R - 28. Bono Length Research performed at NASA, led by...Ch. 3.R - 29. Advertising A small manufacturing firm...Ch. 3.CT - For the linear function f( x )=4x+3 , a. Find the...Ch. 3.CT - Determine whether the given function is linear or...Ch. 3.CT - Graph f(x)= (x3) 2 2 using transformations.Ch. 3.CT - In Problems 4 and 5, a. Determine whether the...Ch. 3.CT - In Problems 4 and 5, a. Determine whether the...Ch. 3.CT - Determine the quadratic function for the given...Ch. 3.CT - Determine whether f( x )=-2 x 2 +12x+3 has a...Ch. 3.CT - Solve, x 2 10x+240 .Ch. 3.CT - The weekly rental cost of a 20-foot recreational...Ch. 3.CT - The price p (in dollars) and the quantity x sold...Ch. 3.CT - Consider these two data sets: One data set follows...Ch. 3.CR - Find the distance between the points P=( 1,3 ) and...Ch. 3.CR - Which of the following points are on the graph of,...Ch. 3.CR - Solve the inequality 5x+30 and graph the solution...Ch. 3.CR - Find the equation of the line containing the...Ch. 3.CR - Find the equation of the line perpendicular to the...Ch. 3.CR - Graph the equation x 2 + y 2 4x+8y5=0 .Ch. 3.CR - Does the following relation represent a function?...Ch. 3.CR - For the function f defined by f( x )= x 2 4x+1 ,...Ch. 3.CR - Find the domain of h(z)= 3z1 6z7 .Ch. 3.CR - Is the following graph the graph of a function?Ch. 3.CR - Consider the function f(x)= x x+4 . a. Is the...Ch. 3.CR - Is the function f(x)= x 2 2x+1 even, odd, or...Ch. 3.CR - Approximate the local maximum values and local...Ch. 3.CR - If f(x)=3x+5 and g(x)=2x+1 , a. Solve f(x)=g( x )...Ch. 3.CR - For the graph of the function f , a. Find the...
Additional Math Textbook Solutions
Find more solutions based on key concepts
Limits at infinity Evaluate the following limits. 11. limcos2
Calculus: Early Transcendentals (2nd Edition)
Choose one of the answers in each case. In statistical inference, measurements are made on a (sample or popula...
Introductory Statistics
For years, telephone area codes in the United States and Canada consisted of a sequence of three digits. The fi...
A First Course in Probability (10th Edition)
Fill in each blank so that the resulting statement is true. An equation that expresses a relationship between t...
Algebra and Trigonometry (6th Edition)
Write a sentence that illustrates the use of 78 in each of the following ways. a. As a division problem. b. As ...
A Problem Solving Approach To Mathematics For Elementary School Teachers (13th Edition)
Knowledge Booster


Learn more about
Need a deep-dive on the concept behind this application? Look no further. Learn more about this topic, calculus and related others by exploring similar questions and additional content below.Similar questions
- 3. Consider the sequences of functions f₁: [-π, π] → R, sin(n²x) An(2) n f pointwise as (i) Find a function ƒ : [-T,π] → R such that fn n∞. Further, show that fn →f uniformly on [-π,π] as n → ∞. [20 Marks] (ii) Does the sequence of derivatives f(x) has a pointwise limit on [-7, 7]? Justify your answer. [10 Marks]arrow_forward1. (i) Give the definition of a metric on a set X. [5 Marks] (ii) Let X = {a, b, c} and let a function d : XxX → [0, ∞) be defined as d(a, a) = d(b,b) = d(c, c) 0, d(a, c) = d(c, a) 1, d(a, b) = d(b, a) = 4, d(b, c) = d(c,b) = 2. Decide whether d is a metric on X. Justify your answer. = (iii) Consider a metric space (R, d.), where = [10 Marks] 0 if x = y, d* (x, y) 5 if xy. In the metric space (R, d*), describe: (a) open ball B2(0) of radius 2 centred at 0; (b) closed ball B5(0) of radius 5 centred at 0; (c) sphere S10 (0) of radius 10 centred at 0. [5 Marks] [5 Marks] [5 Marks]arrow_forward(c) sphere S10 (0) of radius 10 centred at 0. [5 Marks] 2. Let C([a, b]) be the metric space of continuous functions on the interval [a, b] with the metric doo (f,g) = max f(x)g(x)|. xЄ[a,b] = 1x. Find: Let f(x) = 1 - x² and g(x): (i) do(f, g) in C'([0, 1]); (ii) do(f,g) in C([−1, 1]). [20 Marks] [20 Marks]arrow_forward
- Given lim x-4 f (x) = 1,limx-49 (x) = 10, and lim→-4 h (x) = -7 use the limit properties to find lim→-4 1 [2h (x) — h(x) + 7 f(x)] : - h(x)+7f(x) 3 O DNEarrow_forward17. Suppose we know that the graph below is the graph of a solution to dy/dt = f(t). (a) How much of the slope field can you sketch from this information? [Hint: Note that the differential equation depends only on t.] (b) What can you say about the solu- tion with y(0) = 2? (For example, can you sketch the graph of this so- lution?) y(0) = 1 y ANarrow_forward(b) Find the (instantaneous) rate of change of y at x = 5. In the previous part, we found the average rate of change for several intervals of decreasing size starting at x = 5. The instantaneous rate of change of fat x = 5 is the limit of the average rate of change over the interval [x, x + h] as h approaches 0. This is given by the derivative in the following limit. lim h→0 - f(x + h) − f(x) h The first step to find this limit is to compute f(x + h). Recall that this means replacing the input variable x with the expression x + h in the rule defining f. f(x + h) = (x + h)² - 5(x+ h) = 2xh+h2_ x² + 2xh + h² 5✔ - 5 )x - 5h Step 4 - The second step for finding the derivative of fat x is to find the difference f(x + h) − f(x). - f(x + h) f(x) = = (x² x² + 2xh + h² - ])- = 2x + h² - 5h ])x-5h) - (x² - 5x) = ]) (2x + h - 5) Macbook Proarrow_forward
- Evaluate the integral using integration by parts. Sx² cos (9x) dxarrow_forwardLet f be defined as follows. y = f(x) = x² - 5x (a) Find the average rate of change of y with respect to x in the following intervals. from x = 4 to x = 5 from x = 4 to x = 4.5 from x = 4 to x = 4.1 (b) Find the (instantaneous) rate of change of y at x = 4. Need Help? Read It Master Itarrow_forwardVelocity of a Ball Thrown into the Air The position function of an object moving along a straight line is given by s = f(t). The average velocity of the object over the time interval [a, b] is the average rate of change of f over [a, b]; its (instantaneous) velocity at t = a is the rate of change of f at a. A ball is thrown straight up with an initial velocity of 128 ft/sec, so that its height (in feet) after t sec is given by s = f(t) = 128t - 16t². (a) What is the average velocity of the ball over the following time intervals? [3,4] [3, 3.5] [3, 3.1] ft/sec ft/sec ft/sec (b) What is the instantaneous velocity at time t = 3? ft/sec (c) What is the instantaneous velocity at time t = 7? ft/sec Is the ball rising or falling at this time? O rising falling (d) When will the ball hit the ground? t = sec Need Help? Read It Watch Itarrow_forward
arrow_back_ios
SEE MORE QUESTIONS
arrow_forward_ios
Recommended textbooks for you
 Holt Mcdougal Larson Pre-algebra: Student Edition...AlgebraISBN:9780547587776Author:HOLT MCDOUGALPublisher:HOLT MCDOUGAL
 Elementary AlgebraAlgebraISBN:9780998625713Author:Lynn Marecek, MaryAnne Anthony-SmithPublisher:OpenStax - Rice University
 Intermediate AlgebraAlgebraISBN:9781285195728Author:Jerome E. Kaufmann, Karen L. SchwittersPublisher:Cengage Learning
 Algebra and Trigonometry (MindTap Course List)AlgebraISBN:9781305071742Author:James Stewart, Lothar Redlin, Saleem WatsonPublisher:Cengage Learning
Holt Mcdougal Larson Pre-algebra: Student Edition...
Algebra
ISBN:9780547587776
Author:HOLT MCDOUGAL
Publisher:HOLT MCDOUGAL
Elementary Algebra
Algebra
ISBN:9780998625713
Author:Lynn Marecek, MaryAnne Anthony-Smith
Publisher:OpenStax - Rice University
Intermediate Algebra
Algebra
ISBN:9781285195728
Author:Jerome E. Kaufmann, Karen L. Schwitters
Publisher:Cengage Learning
Algebra and Trigonometry (MindTap Course List)
Algebra
ISBN:9781305071742
Author:James Stewart, Lothar Redlin, Saleem Watson
Publisher:Cengage Learning
Points, Lines, Planes, Segments, & Rays - Collinear vs Coplanar Points - Geometry; Author: The Organic Chemistry Tutor;https://www.youtube.com/watch?v=dDWjhRfBsKM;License: Standard YouTube License, CC-BY
Naming Points, Lines, and Planes; Author: Florida PASS Program;https://www.youtube.com/watch?v=F-LxiLSSaLg;License: Standard YouTube License, CC-BY