Concept explainers
Videos
Hurricanes The following data represent the atmospheric pressure (in millibars) and the wind speed (in knots) measured during various tropical systems in the Atlantic Ocean.
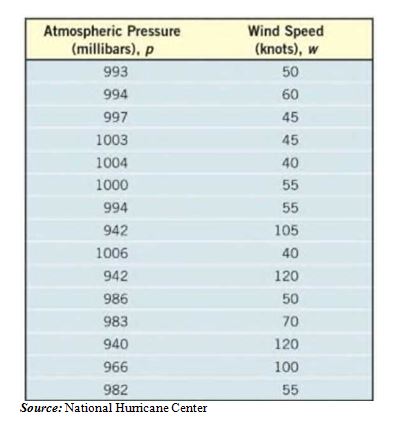
(a) Use a graphing utility to draw a
(b) Use a graphing utility to find the line of best lit that models the relation between atmospheric pressure and wind speed. Express the model using function notation.
(c) Interpret the slope.
(d) Predict the wind speed of a tropical storm if the atmospheric pressure measures 990 millibars.
(e) What is the atmospheric pressure of a hurricane if the wind speed is 85 knots?
Want to see the full answer?
Check out a sample textbook solution
Chapter 3 Solutions
Precalculus Enhanced with Graphing Utilities, Books a la Carte Edition Plus NEW MyLab Math -- Access Card Package (7th Edition)
Additional Math Textbook Solutions
Elementary Statistics: Picturing the World (7th Edition)
Calculus: Early Transcendentals (2nd Edition)
Elementary & Intermediate Algebra
College Algebra Essentials (5th Edition)
Precalculus: A Unit Circle Approach (3rd Edition)
Algebra and Trigonometry (6th Edition)


- 6. [-/1 Points] DETAILS MY NOTES SESSCALCET2 6.5.001. ASK YOUR TEACHER PRACTICE ANOTHER Let I = 4 f(x) dx, where f is the function whose graph is shown. = √ ² F(x 12 4 y f 1 2 (a) Use the graph to find L2, R2 and M2. 42 = R₂ = M₂ = 1 x 3 4arrow_forwardpractice problem please help!arrow_forwardFind a parameterization for a circle of radius 4 with center (-4,-6,-3) in a plane parallel to the yz plane. Write your parameterization so the y component includes a positive cosine.arrow_forward
- ~ exp(10). A 3. Claim number per policy is modelled by Poisson(A) with A sample x of N = 100 policies presents an average = 4 claims per policy. (i) Compute an a priory estimate of numbers of claims per policy. [2 Marks] (ii) Determine the posterior distribution of A. Give your argument. [5 Marks] (iii) Compute an a posteriori estimate of numbers of claims per policy. [3 Marks]arrow_forward2. The size of a claim is modelled by F(a, λ) with a fixed a a maximum likelihood estimate of A given a sample x with a sample mean x = 11 = 121. Give [5 Marks]arrow_forwardRobbie Bearing Word Problems Angles name: Jocelyn date: 1/18 8K 2. A Delta airplane and an SouthWest airplane take off from an airport at the same time. The bearing from the airport to the Delta plane is 23° and the bearing to the SouthWest plane is 152°. Two hours later the Delta plane is 1,103 miles from the airport and the SouthWest plane is 1,156 miles from the airport. What is the distance between the two planes? What is the bearing from the Delta plane to the SouthWest plane? What is the bearing to the Delta plane from the SouthWest plane? Delta y SW Angles ThreeFourthsMe MATH 2arrow_forward
 Glencoe Algebra 1, Student Edition, 9780079039897...AlgebraISBN:9780079039897Author:CarterPublisher:McGraw Hill
 Algebra & Trigonometry with Analytic GeometryAlgebraISBN:9781133382119Author:SwokowskiPublisher:Cengage
 Algebra: Structure And Method, Book 1AlgebraISBN:9780395977224Author:Richard G. Brown, Mary P. Dolciani, Robert H. Sorgenfrey, William L. ColePublisher:McDougal Littell
 Trigonometry (MindTap Course List)TrigonometryISBN:9781337278461Author:Ron LarsonPublisher:Cengage Learning
 Functions and Change: A Modeling Approach to Coll...AlgebraISBN:9781337111348Author:Bruce Crauder, Benny Evans, Alan NoellPublisher:Cengage Learning