Concept explainers
Videos
Life Cycle Hypothesis An individual’s income varies with his or her age. The following table shows the median income I of males of different age groups within the United States for 2012. For each age group, let the class midpoint represent the independent variable, . For the class “65 years and older,” we will assume that the class midpoint is .
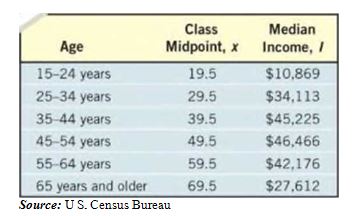
(a) Use a graphing utility to draw a
(b) Use a graphing utility to find the quadratic function of best fit that models the relation between age and median income.
(c) Use the function found in part (b) to determine the age at which an individual can expect to earn the most income.
(d) Use the function found in part (b) to predict the peak income earned.
(e) With a graphing utility, graph the quadratic function of best fit on the scatter diagram.
Want to see the full answer?
Check out a sample textbook solution
Chapter 3 Solutions
Precalculus Enhanced with Graphing Utilities, Books a la Carte Edition Plus NEW MyLab Math -- Access Card Package (7th Edition)
Additional Math Textbook Solutions
College Algebra with Modeling & Visualization (5th Edition)
Elementary Statistics
University Calculus: Early Transcendentals (4th Edition)
Calculus: Early Transcendentals (2nd Edition)


- Exercise 1 Given are the following planes: plane 1: 3x4y+z = 1 0 plane 2: (s, t) = ( 2 ) + ( -2 5 s+ 0 ( 3 t 2 -2 a) Find for both planes the Hessian normal form and for plane 1 in addition the parameter form. b) Use the cross product of the two normal vectors to show that the planes intersect in a line. c) Calculate the intersection line. d) Calculate the intersection angle of the planes. Make a sketch to indicate which angle you are calculating.arrow_forwardOnly 100% sure experts solve it correct complete solutions okarrow_forwardrmine the immediate settlement for points A and B shown in figure below knowing that Aq,-200kN/m², E-20000kN/m², u=0.5, Depth of foundation (DF-0), thickness of layer below footing (H)=20m. 4m B 2m 2m A 2m + 2m 4marrow_forward
- sy = f(x) + + + + + + + + + X 3 4 5 7 8 9 The function of shown in the figure is continuous on the closed interval [0, 9] and differentiable on the open interval (0, 9). Which of the following points satisfies conclusions of both the Intermediate Value Theorem and the Mean Value Theorem for f on the closed interval [0, 9] ? (A A B B C Darrow_forward= Q6 What will be the allowable bearing capacity of sand having p = 37° and ydry 19 kN/m³ for (i) 1.5 m strip foundation (ii) 1.5 m x 1.5 m square footing and (iii)1.5m x 2m rectangular footing. The footings are placed at a depth of 1.5 m below ground level. Assume F, = 2.5. Use Terzaghi's equations. 0 Ne Na Ny 35 57.8 41.4 42.4 40 95.7 81.3 100.4arrow_forwardQ1 The SPT records versus depth are given in table below. Find qan for the raft 12% foundation with BxB-10x10m and depth of raft D-2m, the allowable settlement is 50mm. Elevation, m 0.5 2 2 6.5 9.5 13 18 25 No.of blows, N 11 15 29 32 30 44 0 estigate shear 12%arrow_forward
 Glencoe Algebra 1, Student Edition, 9780079039897...AlgebraISBN:9780079039897Author:CarterPublisher:McGraw Hill
 Big Ideas Math A Bridge To Success Algebra 1: Stu...AlgebraISBN:9781680331141Author:HOUGHTON MIFFLIN HARCOURTPublisher:Houghton Mifflin Harcourt
 Holt Mcdougal Larson Pre-algebra: Student Edition...AlgebraISBN:9780547587776Author:HOLT MCDOUGALPublisher:HOLT MCDOUGAL
 Trigonometry (MindTap Course List)TrigonometryISBN:9781337278461Author:Ron LarsonPublisher:Cengage Learning