The data set in Table 3.12 is based on 214 children with acute otitis media (otitis media with effusion, or OME) who participated in a randomized clinical trial [13], Each child had OME at the beginning of the study in either one (unilateral cases) or both (bilateral cases) ears and was randomly assigned to receive a 14-day course of one of two antibiotics, either cefaclor (CEF) or amoxicillin (AMO). The data here concern the 203 children whose middle-ear status was determined during a 14-day follow-up visit. The data in Table 3.12 are presented in data set EAR.DAT (at www I .cengagebrain.com). The investigators recorded the ages of the children because they felt this might be an important factor in determining outcome. Were they right? Try to express your results in terms of RR.
The data set in Table 3.12 is based on 214 children with acute otitis media (otitis media with effusion, or OME) who participated in a randomized clinical trial [13], Each child had OME at the beginning of the study in either one (unilateral cases) or both (bilateral cases) ears and was randomly assigned to receive a 14-day course of one of two antibiotics, either cefaclor (CEF) or amoxicillin (AMO). The data here concern the 203 children whose middle-ear status was determined during a 14-day follow-up visit. The data in Table 3.12 are presented in data set EAR.DAT (at www I .cengagebrain.com). The investigators recorded the ages of the children because they felt this might be an important factor in determining outcome. Were they right? Try to express your results in terms of RR.
Solution Summary: The author explains how to obtain counts using the MINITAB software.
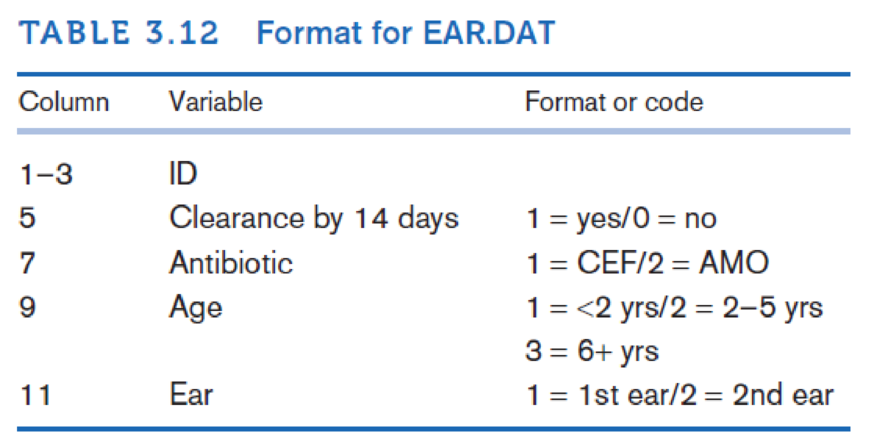
The data set in Table 3.12 is based on 214 children with acute otitis media (otitis media with effusion, or OME) who participated in a randomized clinical trial [13], Each child had OME at the beginning of the study in either one (unilateral cases) or both (bilateral cases) ears and was randomly assigned to receive a 14-day course of one of two antibiotics, either cefaclor (CEF) or amoxicillin (AMO). The data here concern the 203 children whose middle-ear status was determined during a 14-day follow-up visit. The data in Table 3.12 are presented in data set EAR.DAT (at www I .cengagebrain.com).
The investigators recorded the ages of the children because they felt this might be an important factor in determining outcome. Were they right? Try to express your results in terms of RR.
Cycles to
failure
Position in
ascending
order
0.5
f(x))
(x;)
Problem 44
Marsha, a renowned cake scientist, is trying to determine how long different cakes can survive intense fork attacks before collapsing into crumbs.
To simulate real-world cake consumption, she designs a test where cakes are subjected to repeated fork stabs and bites, mimicking the brutal
reality of birthday parties. After rigorous testing, Marsha records 10 observations of how many stabs each cake endured before structural failure.
Construct P-P plots for (a.) a normal distribution, (b.) a lognormal distribution, and (c.) a Weibull distribution (using the information included in the
table below). Which distribution seems to be the best model for the cycles to failure for this material? Explain your answer in detail.
Observation
Empirical
cumulative
Probability distribution
Cumulative distribution
Inverse of cumulative
distribution F-1 (-0.5)
F(x))
(S)
n
4
3
1
0.05
9
5
2
0.15
7
7
3
0.25
1
10
4
0.35
3
12
5
0.45
Normal…
Problem 3
In their lab, engineer Daniel and Paulina are desperately trying to perfect time travel. But the problem is that
their machine still struggles with power inconsistencies-sometimes generating too little energy, other times
too much, causing unstable time jumps. To prevent catastrophic misjumps into the Jurassic era or the far
future, they must calibrate the machine's power output. After extensive testing, they found that the time
machine's power output follows a normal distribution, with an average energy level of 8.7 gigawatts and a
standard deviation of 1.2 gigawatts.
The Time Travel Safety Board has set strict guidelines: For a successful time jump, the
machine's power must be between 8.5 and 9.5 gigawatts. What is the probability that a randomly
selected time jump meets this precision requirement?
Daniel suggests that adjusting the mean power output could improve time-travel accuracy.
Can adjusting the mean reduce the number of dangerous misjumps? If yes, what should the…
Problem 5 (
Marybeth is also interested in the experiment from Problem 2 (associated with the enhancements for Captain
America's shield), so she decides to start a detailed literature review on the subject. Among others, she found
a paper where they used a 2"(4-1) fractional factorial design in the factors: (A) shield material, (B) throwing
mechanism, (C) edge modification, and (D) handle adjustment. The experimental design used in the paper is
shown in the table below.
a.
Run
A
B
с
D
1
(1)
-1
-1
-1
1
2
a
1
-1
-1
1
3
bd
-1
1
-1
1
4
abd
1
1
-1
1
5
cd
-1
-1
1
-1
6
acd
1
-1
1
-1
7
bc
-1
1
1
-1
abc
1
1
1
-1
paper?
s) What was the generator used in the 2"(4-1) fractional factorial design described in the
b.
Based on the resolution of this design, what do you think about the generator used in the
paper? Do you think it was a good choice, or would you have selected a different one? Explain your
answer in detail.
Need a deep-dive on the concept behind this application? Look no further. Learn more about this topic, statistics and related others by exploring similar questions and additional content below.
Introduction to experimental design and analysis of variance (ANOVA); Author: Dr. Bharatendra Rai;https://www.youtube.com/watch?v=vSFo1MwLoxU;License: Standard YouTube License, CC-BY


 Holt Mcdougal Larson Pre-algebra: Student Edition...AlgebraISBN:9780547587776Author:HOLT MCDOUGALPublisher:HOLT MCDOUGAL
 College Algebra (MindTap Course List)AlgebraISBN:9781305652231Author:R. David Gustafson, Jeff HughesPublisher:Cengage Learning