Cardiovascular Disease The ankle-arm blood-pressure index (AAI) is defined as the ratio of ankle systolic blood pressure/arm systolic blood pressure and is used for the diagnosis of lower extremity arterial disease. A study was conducted to investigate whether the AAI can be used as a screening test for atherosclerotic diseases in general [20]. The subjects were 446 male workers in a copper smelter in Japan. Each subject had an AAI determination as well as an electrocardiogram (ECG). From the ECG, an S-T segment depression was defined as an S-T segment ≥ 0.1 mV below the baseline in at least 1 of 12 leads in a resting ECG. S-T segment depression is often used as one characterization of an abnormal ECG. The data in Table 3.22 were presented relating AAI to S-T segment depression. Table 3.22 Association between ankle-arm blood-pressure index (AAI) and S-T segment depression What is the PV + ? ( Hint : Assume that the subjects in this study are a random sample from the general population of Japan.)
Cardiovascular Disease The ankle-arm blood-pressure index (AAI) is defined as the ratio of ankle systolic blood pressure/arm systolic blood pressure and is used for the diagnosis of lower extremity arterial disease. A study was conducted to investigate whether the AAI can be used as a screening test for atherosclerotic diseases in general [20]. The subjects were 446 male workers in a copper smelter in Japan. Each subject had an AAI determination as well as an electrocardiogram (ECG). From the ECG, an S-T segment depression was defined as an S-T segment ≥ 0.1 mV below the baseline in at least 1 of 12 leads in a resting ECG. S-T segment depression is often used as one characterization of an abnormal ECG. The data in Table 3.22 were presented relating AAI to S-T segment depression. Table 3.22 Association between ankle-arm blood-pressure index (AAI) and S-T segment depression What is the PV + ? ( Hint : Assume that the subjects in this study are a random sample from the general population of Japan.)
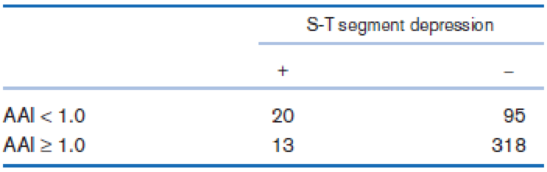
Solution Summary: The author explains that the PV+ is 0.174. Predictive value positive is defined as ankle-arm blood-pressure index less than 1.0, and S-T segment depression positive.
The ankle-arm blood-pressure index (AAI) is defined as the ratio of ankle systolic blood pressure/arm systolic blood pressure and is used for the diagnosis of lower extremity arterial disease. A study was conducted to investigate whether the AAI can be used as a screening test for atherosclerotic diseases in general [20]. The subjects were 446 male workers in a copper smelter in Japan. Each subject had an AAI determination as well as an electrocardiogram (ECG). From the ECG, an S-T segment depression was defined as an S-T segment ≥ 0.1 mV below the baseline in at least 1 of 12 leads in a resting ECG. S-T segment depression is often used as one characterization of an abnormal ECG. The data in Table 3.22 were presented relating AAI to S-T segment depression.
Table 3.22 Association between ankle-arm blood-pressure index (AAI) and S-T segment depression
What is the PV+? (Hint: Assume that the subjects in this study are a random sample from the general population of Japan.)
please find the answers for the yellows boxes using the information and the picture below
A marketing agency wants to determine whether different advertising platforms generate significantly different levels of customer engagement. The agency measures the average number of daily clicks on ads for three platforms: Social Media, Search Engines, and Email Campaigns. The agency collects data on daily clicks for each platform over a 10-day period and wants to test whether there is a statistically significant difference in the mean number of daily clicks among these platforms. Conduct ANOVA test.
You can provide your answer by inserting a text box and the answer must include: also please provide a step by on getting the answers in excel
Null hypothesis,
Alternative hypothesis,
Show answer (output table/summary table), and
Conclusion based on the P value.
A company found that the daily sales revenue of its flagship product follows a normal distribution with a mean of $4500 and a standard deviation of $450. The company defines a "high-sales day" that is, any day with sales exceeding $4800. please provide a step by step on how to get the answers
Q: What percentage of days can the company expect to have "high-sales days" or sales greater than $4800?
Q: What is the sales revenue threshold for the bottom 10% of days? (please note that 10% refers to the probability/area under bell curve towards the lower tail of bell curve)
Provide answers in the yellow cells
Need a deep-dive on the concept behind this application? Look no further. Learn more about this topic, statistics and related others by exploring similar questions and additional content below.
Hypothesis Testing - Solving Problems With Proportions; Author: The Organic Chemistry Tutor;https://www.youtube.com/watch?v=76VruarGn2Q;License: Standard YouTube License, CC-BY
Hypothesis Testing and Confidence Intervals (FRM Part 1 – Book 2 – Chapter 5); Author: Analystprep;https://www.youtube.com/watch?v=vth3yZIUlGQ;License: Standard YouTube License, CC-BY


 Glencoe Algebra 1, Student Edition, 9780079039897...AlgebraISBN:9780079039897Author:CarterPublisher:McGraw Hill
 Holt Mcdougal Larson Pre-algebra: Student Edition...AlgebraISBN:9780547587776Author:HOLT MCDOUGALPublisher:HOLT MCDOUGAL
 Big Ideas Math A Bridge To Success Algebra 1: Stu...AlgebraISBN:9781680331141Author:HOUGHTON MIFFLIN HARCOURTPublisher:Houghton Mifflin Harcourt