Commonly used vaccines for influenza are trivalent and contain only one type of influenza B virus. They may be ineffective against other types of influenza B virus. A randomized clinical trial was performed among children 3 to 8 years of age in 8 countries. Children received either a quadrivalent vaccine (QIV) that had more than one influenza B virus or a trivalent Hepatitis A vaccine (control) (Jain, et al., [9]. New England Journal of Medicine 2013: 369(26): 2481–2491). An attack rate (i.e.,% of children who developed influenza) starting 14 days after vaccination until the end of the study was computed for each vaccine group, stratified by age. The following data were reported: Table 3.7 Attack rate for influenza by age and treatment group Suppose 3 children in a village ages 3, 5, and 7 are vaccinated with the QIV vaccine. What is the probability that at least one child among the 3 will get influenza?
Commonly used vaccines for influenza are trivalent and contain only one type of influenza B virus. They may be ineffective against other types of influenza B virus. A randomized clinical trial was performed among children 3 to 8 years of age in 8 countries. Children received either a quadrivalent vaccine (QIV) that had more than one influenza B virus or a trivalent Hepatitis A vaccine (control) (Jain, et al., [9]. New England Journal of Medicine 2013: 369(26): 2481–2491). An attack rate (i.e.,% of children who developed influenza) starting 14 days after vaccination until the end of the study was computed for each vaccine group, stratified by age. The following data were reported: Table 3.7 Attack rate for influenza by age and treatment group Suppose 3 children in a village ages 3, 5, and 7 are vaccinated with the QIV vaccine. What is the probability that at least one child among the 3 will get influenza?
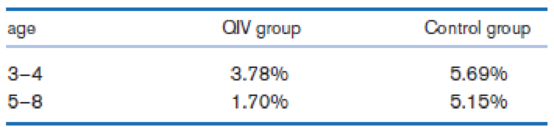
Commonly used vaccines for influenza are trivalent and contain only one type of influenza B virus. They may be ineffective against other types of influenza B virus. A randomized clinical trial was performed among children 3 to 8 years of age in 8 countries. Children received either a quadrivalent vaccine (QIV) that had more than one influenza B virus or a trivalent Hepatitis A vaccine (control) (Jain, et al., [9]. New England Journal of Medicine 2013: 369(26): 2481–2491). An attack rate (i.e.,% of children who developed influenza) starting 14 days after vaccination until the end of the study was computed for each vaccine group, stratified by age. The following data were reported:
Table 3.7 Attack rate for influenza by age and treatment group
Suppose 3 children in a village ages 3, 5, and 7 are vaccinated with the QIV vaccine. What is the probability that at least one child among the 3 will get influenza?
NC Current Students - North Ce X | NC Canvas Login Links - North ( X
Final Exam Comprehensive x Cengage Learning
x
WASTAT - Final Exam - STAT
→
C
webassign.net/web/Student/Assignment-Responses/submit?dep=36055360&tags=autosave#question3659890_9
Part (b)
Draw a scatter plot of the ordered pairs.
N
Life
Expectancy
Life
Expectancy
80
70
600
50
40
30
20
10
Year of
1950
1970 1990
2010 Birth
O
Life
Expectancy
Part (c)
800
70
60
50
40
30
20
10
1950
1970 1990
W
ALT
林
$
#
4
R
J7
Year of
2010 Birth
F6
4+
80
70
60
50
40
30
20
10
Year of
1950 1970 1990
2010 Birth
Life
Expectancy
Ox
800
70
60
50
40
30
20
10
Year of
1950 1970 1990 2010 Birth
hp
P.B.
KA
&
7
80
% 5
H
A
B
F10
711
N
M
K
744
PRT SC
ALT
CTRL
Need a deep-dive on the concept behind this application? Look no further. Learn more about this topic, statistics and related others by exploring similar questions and additional content below.
Introduction to experimental design and analysis of variance (ANOVA); Author: Dr. Bharatendra Rai;https://www.youtube.com/watch?v=vSFo1MwLoxU;License: Standard YouTube License, CC-BY


 College Algebra (MindTap Course List)AlgebraISBN:9781305652231Author:R. David Gustafson, Jeff HughesPublisher:Cengage Learning