Radiology Mobile displays have the potential to increase the flexibility of consulting radiologists if they can be shown to be comparable to traditional display modalities. A study was performed comparing a mobile display iPad 2 with a larger liquid crystal display (LCD) for the diagnosis of tuberculosis (TB) on chest radiography (Abboud et al., [19]). De-identified images of 240 chest X-rays were transferred from a PACS workstation (LCD) to an iPad 2 tablet. The images were reviewed independently by 5 radiologists and were graded as positive or negative for TB on both the LCD and the iPad 2. The reviews occurred at different times to avoid recall bias. A database of > 500 chest X-rays was created from TB screening films over a 4-month period. Of these, 200 cases originally interpreted as TB-negative and 40 cases originally interpreted as TB-positive were selected at random for study. The images were re-reviewed using both an LCD and an iPad 2 imaging display, albeit at different times. The results were as shown in Table 3.21. Table 3.21 Comparison of TB screening results using an LCD and iPad 2 display The selection of images for this study was enriched to increase the number of images originally interpreted as positive. Suppose the underlying percentage of positive TB tests is 10% in a large sample of chest X-rays assessed by LCD. If a subject tests positive on an iPad 2 display, then what is the probability that he(she) will also test positive on the LCD?
Radiology Mobile displays have the potential to increase the flexibility of consulting radiologists if they can be shown to be comparable to traditional display modalities. A study was performed comparing a mobile display iPad 2 with a larger liquid crystal display (LCD) for the diagnosis of tuberculosis (TB) on chest radiography (Abboud et al., [19]). De-identified images of 240 chest X-rays were transferred from a PACS workstation (LCD) to an iPad 2 tablet. The images were reviewed independently by 5 radiologists and were graded as positive or negative for TB on both the LCD and the iPad 2. The reviews occurred at different times to avoid recall bias. A database of > 500 chest X-rays was created from TB screening films over a 4-month period. Of these, 200 cases originally interpreted as TB-negative and 40 cases originally interpreted as TB-positive were selected at random for study. The images were re-reviewed using both an LCD and an iPad 2 imaging display, albeit at different times. The results were as shown in Table 3.21. Table 3.21 Comparison of TB screening results using an LCD and iPad 2 display The selection of images for this study was enriched to increase the number of images originally interpreted as positive. Suppose the underlying percentage of positive TB tests is 10% in a large sample of chest X-rays assessed by LCD. If a subject tests positive on an iPad 2 display, then what is the probability that he(she) will also test positive on the LCD?
Solution Summary: The author calculates the probability that test positive on an iPad 2 display is 0.956. If A_1,mathrm...
Mobile displays have the potential to increase the flexibility of consulting radiologists if they can be shown to be comparable to traditional display modalities. A study was performed comparing a mobile display iPad 2 with a larger liquid crystal display (LCD) for the diagnosis of tuberculosis (TB) on chest radiography (Abboud et al., [19]). De-identified images of 240 chest X-rays were transferred from a PACS workstation (LCD) to an iPad 2 tablet. The images were reviewed independently by 5 radiologists and were graded as positive or negative for TB on both the LCD and the iPad 2. The reviews occurred at different times to avoid recall bias.
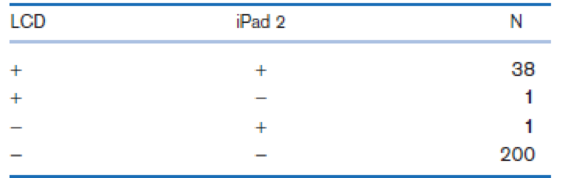
A database of > 500 chest X-rays was created from TB screening films over a 4-month period. Of these, 200 cases originally interpreted as TB-negative and 40 cases originally interpreted as TB-positive were selected at random for study. The images were re-reviewed using both an LCD and an iPad 2 imaging display, albeit at different times. The results were as shown in Table 3.21.
Table 3.21 Comparison of TB screening results using an LCD and iPad 2 display
The selection of images for this study was enriched to increase the number of images originally interpreted as positive. Suppose the underlying percentage of positive TB tests is 10% in a large sample of chest X-rays assessed by LCD.
If a subject tests positive on an iPad 2 display, then what is the probability that he(she) will also test positive on the LCD?
An electronics company manufactures batches of n circuit boards. Before a batch is approved for shipment,
m boards are randomly selected from the batch and tested. The batch is rejected if more than d boards in
the sample are found to be faulty.
a) A batch actually contains six faulty circuit boards. Find the probability that the batch is rejected when
n = 20, m = 5, and d = 1.
b) A batch actually contains nine faulty circuit boards. Find the probability that the batch is rejected when
n = 30, m = 10, and d = 1.
Twenty-eight applicants interested in working for the Food Stamp program took an examination designed
to measure their aptitude for social work. A stem-and-leaf plot of the 28 scores appears below, where the
first column is the count per branch, the second column is the stem value, and the remaining digits are the
leaves.
a) List all the values.
Count
1
Stems
Leaves
4
6
1
4
6
567
9
3688
026799
9
8
145667788
7
9
1234788
b) Calculate the first quartile (Q1) and the third Quartile (Q3).
c) Calculate the interquartile range.
d) Construct a boxplot for this data.
Pam, Rob and Sam get a cake that is one-third chocolate, one-third vanilla, and one-third strawberry as shown below. They wish to fairly divide the cake using the lone chooser method. Pam likes strawberry twice as much as chocolate or vanilla. Rob only likes chocolate. Sam, the chooser, likes vanilla and strawberry twice as much as chocolate. In the first division, Pam cuts the strawberry piece off and lets Rob choose his favorite piece. Based on that, Rob chooses the chocolate and vanilla parts. Note: All cuts made to the cake shown below are vertical.Which is a second division that Rob would make of his share of the cake?
Need a deep-dive on the concept behind this application? Look no further. Learn more about this topic, statistics and related others by exploring similar questions and additional content below.
Introduction to experimental design and analysis of variance (ANOVA); Author: Dr. Bharatendra Rai;https://www.youtube.com/watch?v=vSFo1MwLoxU;License: Standard YouTube License, CC-BY


 Big Ideas Math A Bridge To Success Algebra 1: Stu...AlgebraISBN:9781680331141Author:HOUGHTON MIFFLIN HARCOURTPublisher:Houghton Mifflin Harcourt
 Linear Algebra: A Modern IntroductionAlgebraISBN:9781285463247Author:David PoolePublisher:Cengage Learning